


Introduction and Results Tutorial
__________________________________________________
This tutorial is based on a pre-release
version of DxO Analyzer.
Therefore, test methodologies may be altered prior to commercial release.
These tests will also include several customized charts in order to present
complex data,
and I may decide to change these over time as my experience with this product
grows.
__________________________________________________
How do a lens’ or camera’s optical capabilities affect image quality? Why spend
$1,000 for a lens when there’s one of similar focal length and aperture available
for half the price? And what about digital sensors? These have optical characteristics
as well, and when combined with any given lens together they produce a unique
result.
Historically there have been three primary ways of measuring a lens’ optical
quality — the manufacturer’s MTF chart, shooting a resolution chart, and
using an optical bench. Each has its place, but none is the ideal solution.
MTF charts are produced with sophisticated equipment and are usually only available
from the lens manufacturer themselves. Also, MTF charts from different companies
can’t be compared because there is no standardized presentation format. Some
manufacturers’ MTF charts are theoretical for a particular lens design while
others are based on real-world measurements. They’re also difficult for the
layman to understand.
Shooting a resolution chart, which many independent testers do, is fine as
far as it goes — which isn’t very far. All it tells you is about resolution.
There’s no information from such a test regarding vignetting, aberration, distortion,
blur or any other lens characteristic other than resolution. And even then,
measuring lines/mm isn’t the complete story. Far from it.
It is also worth keeping in mind the difference between the concept of resolution
— the smallest detail that gets imaged, and sharpness —
how crisply image features are reproduced.
The use of an optical bench (expensive and difficult to use properly) tells
a lot more, but due to price is limited in application. It also can only be
used with a lens by itself. It can’t be used to measure a digital camera and
its sensor in combination with a given lens. And since a sensor and lens form
a complete optical system, such test benches are now of declining usefulness.
But photographers as well as nature abhors a vacuum, and into this space we
now have a new testing system — DxO Analyzer from DO
Labs in France.
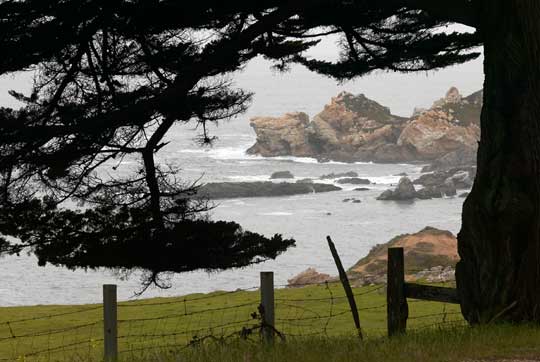
Surf & Turf. Big Sur, California — February, 2003
Canon EOS 1Ds with 135mm f/2.0L lens @ ISO 100
__________________________________________________
The Origins
In mid-February, 2004 DO Labs announced
at the PMA trade show in Las Vegas a new optical testing system
designed specifically for measuring lenses and digital cameras. DxO
Analyzer carries an annual license fee of approximately U.S. $20,000
/ year. That’s the bad news. The good news is that DO Labs
is making it available to selected journalists, reviewers and magazines at a
discounted price. The method to their madness is that as the acceptance of DxO
Analyzer‘s test methodology grows and becomes something of an industry
standard, lens and digital camera makers will wish to adopt this test suite
themselves. Of course DO Labs‘ business plan is their affair,
but the beneficiaries of this program are us — photographers — who
now have a uniform, reliable and consistent test system. I anticipate that many
major photographic magazines as well as web sites will adopt this system. Even
at this early stage, the respected French magazine Chasseur
d’Image and the Imaging
Resource web site have adopted DxO Analyzer, as of course
so has The Luminous Landscape. (A press release
regarding the introduction of DxO Analyzer can be found
here).
As to who DO Labs is — they are an applied
mathematics and imaging software company. Their staff has quite a few PhDs and
top-end mathematicians, and DxO Analyzer represents a great
deal of effort by some of the best minds in the field. By way of full disclosure,
I have been involved with Do Labs for about 5 months prior
to the announcement and introduction of the system, having acted as something
of a consultant to the company as well as an alpha and beta tester of the system.
Am I biased? Yup. Very.
__________________________________________________
How it Works
The DxO Analyzer system consists of two components. The first is a large sheet
of heavy plate glass onto which has been applied a series of precision dots.
This is set up so that the camera / lens system is absolutely plane parallel
to it and the chart fills the field of view. The target also has to be lit evenly
to within one tenth of an F stop. The second part of the system is analysis
software which runs on a Windows XP system.
To test a lens / camera one shoots the target at each aperture desired, and
in the case of a zoom lens, at each focal length desired. Tests at every ISO
setting are also needed when testing cameras. Thus even an evaluation at just
4 apertures, 3 sample focal lengths, and 4 ISO settings requires conducting
48 separate exposures and measurements.
The images taken are then loaded into the software and individual tests are
run. The output is a large series of charts and data tables which describe a
range of optical characteristics, which are detailed and explained below. These
can also be exported to HTML files as well as collated in an Excel spreadsheet.
Of course a natural question is — what about human error? Will two testers
produce different results? The answer is that this is highly unlikely. The DxO
software simply refuses to process a test file which hasn’t been properly produced.
If the lighting isn’t completely uniform, or the target doesn’t properly fill
the frame, or the target and the lens aren’t plane parallel, the software lets
you know. It couldn’t be more foolproof.
How consistent are the results? I am told that tests are repeatable within
.02%. That’s a level of precision that hasn’t been seen before from an optical
test system.
__________________________________________________
Some Caveats
Before diving into a description and explanation of each of the
tests, a few words are needed to explain the system’s limitations as well as
some concerns about this type of testing in general.
— DxO Analyzer
can only be used to test lenses in combination with a digital sensor.
A lens by itself can not be tested, and a lens in combination with a film
camera can not be tested.— In
the case of DSLRs and interchangeable lenses, measurements are only meaningful
for a specific type of combination. For example, a 135mm lens on a full-frame
Canon 1Ds will measure differently than on a reduced frame Canon 10D. This
of course is because much more of the lens is being used by the full-frame
camera and therefore most measurements will differ due to the difference
in coverage.— Identical
lenses, aren’t. No two cameras or lenses are the same. Even ones off the
same assembly line. It isn’t unusual to find significant variance, and indeed
some pros typically test a number of lenses of the same brand and type before
choosing one.— Only test results of
lenses of similar focal lengths should be compared with each other. Long
lenses are always going to perform as well as measure better than wide-angle
lenses, regardless of brand or price.— Don’t
compare zooms and prime lenses at the same focal length. With very few exceptions
prime lenses will always be superior to zooms. The trade-off is convenience.— Measurements
don’t tell the whole story. One camera / lens combination may perform better
optically than another, yet because of design, handling and other non-measurable
performance differences be less desirable for actually producing photographs
than one that measures better.— Small
differences may not be important. Learn to read the results properly. Just
because there is a small measurable difference between one system and another
doesn’t mean that this difference is necessarily visible on a print —
regardless of size.— Please don’t ask
me to perform measurements on any specific camera or lens. I will be using
DxO Analyzer to test new lenses and digital cameras that
come my way, beginning as of late February, 2004. I will also over time
test all of the digital cameras and lenses that I already have available
to me. But, I am not in the testing business, and don’t intend to provide
this capability as a service to others, other than as part of my usual reviews.
There’s a great deal of work involved in conducting these tests, and many
hours go into producing, analyzing, organizing and publishing the results.— The lens used in the tutorial below
is a Canon 135mm f/2L used on a Canon 1Ds.
I chose this lens because it is one of Canon’s (and for that matter anyone’s)
best lenses, and therefore gives something of a benchmark to compare other
lenses to. I used the Canon 1Ds because at the time of this writing (February,
2004) this is one of the highest resolution full-frame digital cameras on
the market. During the past year or so it has become something of a benchmark
itself for image quality, and it is in use by large numbers of professional
photographers worldwide.__________________________________________________
The Tests Explained
DxO Analyzer produces five separate measurements in four catagories.
These are…
1: Distortion and Chromatic Aberration
2: Vignetting
3: Noise
4: Blur
Below we will look at each of these tests in turn and explain what it is that’s
being measured. All tests in the examples below were of a Canon 135mm
f/2L lens used on a Canon 1Ds camera, taken at ISO
100, and with an aperture of f/5.6. A full test suite on a given lens / camera
combination would show several different apetures, and in the case of zoom lenses
a selection of focal lengths as well. Remember — this page is a tutorial,
not a test report on this particular camera and lens combination. These are
shown here simply for the purpose of illustration.
__________________________________________________
Distortion and Chromatic Aberration

 |
 |
 |
 |
 |
 |
Distortion
In the green text chart above, under the Distortion
heading, you will see a Maximum distortion reading of -0.19%. Because
the number is negative it means that the distortion that this lens displays
is of the pincushion variety. If the number had been positive the
distortion will be of the barrel variety. The chart also shows that
this lens displays an average distortion level of 0.09%.The grid displayed to the right of the green text chart is a
5X magnification of the distortion displayed. This magnification is done to
help us visualize the degree of distortion, and is there for visual reference
purposes only. A 1:1 grid would not show any visible distortion except in
the worst cases.The way distortion is measured is relative to a straight line
across the image. Points at either end are measured and then the worst point
on that line is taken and a percentage variance is measured. In this test
example the lens shows a worst case distortion of the pincushion
type of less than two tenths of one percent, and an average across the lens’
field of coverage of seven hundredths of one percent. Very small indeed.Chromatic Aberration
The next four boxes; the yellow box, the blue / magenta coloured
box, and the last two graphs, are used to describe Lateral Chromatic
Aberration, usually referred to as CA.Lateral CA is a measurement of the extent to which an optical
system records all three primary colours (Red / Blue / Green) in exact registration
with each other. If a lens is less than prefect (and likely no lens
is perfect) then one can see colour fringing, especially around specular highlights
and along the edges of strong brightness transitions.On the green coloured text chart you’ll see that this example
lens shows a maximum of .32 pixels of CA, and an average across the lens of
.20 pixels between any of the three primary colours.The second set of numbers, in this case a Maximum of 0.07 /
1000 and an Average of 0.04 / 1000 is intended to help in comparing performance
between different cameras that have different pixel sizes. In math-speak,
the numbers have been normalized. It is these numbers that should
be used when comparing cameras of differing resolutions.The final set of numbers have been normalized to be the equivalent
to a 35mm transparency by computing from pixels to millimeters. In this case
since we’re dealing with a full-frame sensor there is no difference.The yellow chart is intended to show CA on a scale of 0 to 5.
If the image is yellow, CA is low, and if it’s dark red then CA is closer
to 5. Since the average CA of this sample lens is just -0.19 pixels the chart
is obviously uniformly yellow.The Relative chart beside it shows how CA manifests itself for
a particular lens. The dark blue and magenta areas show the relative
performance of the lens between the maximum and minimum CA performance. In
other words, the dark blue area is the area of maximum CA, while the magenta
area shows the areas of minimum CA. This should not be used to compare lenses,
since the colour differential will always be the same whether the worst case
is 0.1 pixel widths of CA or 5 pixel widths of CA. It should be thought of
as more like a CA histogram, because it shows relative
not absolute values.The last two graphs show the CA spread across the radius of
the lens’ coverage. The vertical scale is in pixels and the horizontal scale
is in percentage distance from the center of the lens to the corner. The first
chart shows the number of pixels by which the red plane varies from the green
plane, and in the second chart we see how the blue pixel plane varies from
the green pixel plane.When comparing graphs between lenses please note any differences
in the scaling, because DxO Analyzer automatically scales these graphs for
maximum readability. Even the two graphs above for the same lens have different
scales.
The above chart is not generated by DxO Analyzer,
but rather is generated in Excel from the comprehensive chromatic aberration
data. It shows measurements taken at three focal lengths, and at selected
apertures. The vertical axis shows the average CA in pixel widths. Please
note that this is the Average CA, not the maximum values that are
reported in the other charts. (Also note that this chart does not relate
to the example camera and lens shown in other examples on this page, but rather
a digicam with built-in zoom lens).The propose of the chart is to provide a simple visual presentation
of a complex series of numbers. In this sample it makes instantly clear that
at medium focal lengths this particular camera / lens combination has much
lower Average CA than it does at either the wide angle or telephoto parts
of its focal range.__________________________________________________

Vignetting
 |
 |
 |
The blue text chart for Vignetting shows that this lens has a
maximum attenuation of 0.20 IL. IL stands for Illumination Index and
is equal to one F stop. So this lens shows a maximum fall-off of two tenths
of a stop. This is also shown as a percentage. In this case it is 13.09%.
It needs to be noted that vignetting is very much dependant on
light level. Lenses will show illumination fall-off to a greater extent at low
light levels than at high light levels. Since my tests are done in a studio
under uniform and consistent lighting conditions these test results are valid
between samples. But if another tester using this system does his or her measurements
at dramatically different brightness levels (highly unlikely though), results
may not be comparable.
The next chart shows a gray scale rendition of the pattern of
vignetting that the lens produces. This is a highly exaggerated rendition
so as to be visible here on-screen, and since each one will be manually adjusted
for optimum visibility these charts should not be used to make comparisons between
lenses. Use the numbers, not the chart.
The dot on the chart is the geometric center of the lens, while
the cross shows the center of the vignetting. Note that this is not the point
of least vignetting, but rather the center of the vignetting phenomena.
The dX and dY numbers measure the percentage shift between the optical center
of the lens and the Vignetting center, measured on both the X (horizontal) and
the Y (vertical) axis.
The final chart is a Normalized Attenuation Profile.
The horizontal axis is measured radially in pixels from the center of the image
to the corner, and it simply shows in graphic form how smooth the fall-off
of the lens is.
__________________________________________________
Noise
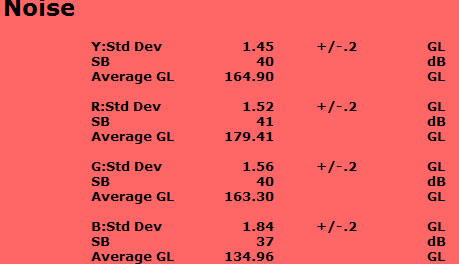
This text chart shows noise measurements for the Y
— Luminance, R — Red, G —
Green and B — Blue channels. Obviously this measurement
pertains to digital sensors rather than lenses, but since with DxO Analyzer
we are in fact measuring a complete optical system of both lens and
sensor it is a highly relevant measurement. For those that are interested,
the Luminance value in these tests is based on ratios of R=0.299, G=0.587, B=0.114.
GL refers to Gray Level. Obviously noise varies
based on the relative brightness of the subject being measured. Bright areas
will be less noisy than dark areas. This subject is explored in my essay titled
Expose to The Right. In this example
the image is being measured at an average GL of 164.5, which of course is on
an 8 bit scale of 0-255, with 0 being black and 255 being white.
The Signal to Noise Ratio (SB) at this brightness level for this
camera is 40db in the Luminance channel, and you can also see the SB for the
separate R, G and B channels. A Standard Deviation of +/- .2 is shown, which
tells us that this signal to noise ratio is found consistently within this brightness
range.
NB: The current pre-release version of DxO
Analyzer (Feb, 2004) basis its S/N readings on a single average Gray Level.
Since this is difficult to accurately match between test cameras it is not yet
appropriate to compare S/N readings between camera systems. It also does not
provide sufficient information about how a particular camera’s sensor responds
to noise as the exposure value is varied.
__________________________________________________
Blur


The measurements up until now have been fairly standard and familiar.
But with the introduction of DxO Analyzer, DO
Labs has introduced a new unit of measurement called the Blur
Experience Unit, or BxU.
Once again the Y reading is for the Luminance channel, and the
R, G and B results as well are shown for both center and corner. The particular
corner whose result is shown in this table is the top right hand corner.
In this example the lens is showing a BxU measurement of 2.12
+/- 5% at the center. The BxU is a relative unit, and the numbers are additive.
So, it’s easy to see that there is nearly 1 BxU difference
between the center reading and the upper right corner when this lens is measured
at f/5.6. How much is that? Simple. A BxU has been defined
as the equivalent of one “Blur More” function
in Photoshop. So, it’s easy to see for yourself how much this represents
visually by simply loading an image into Photoshop and selecting Filter
/ Blur / Blur More. The change that you see is +1 BxU.
The BxU is precise, can be repeatably measured, and is independent
of resolution. Another way to visualize it is that a perfect circle formed by
a point of light would have a BxU of 0.
In all, 17 areas of the screen are measured, and as can be seen
from the second chart these areas are identified with numbers for 1-17, and
are found by spiraling from upper right to upper left, then down and around.
Each square shows the BxU measurement in its area, and in the center square
(#0) we have a measurement for the center of the image area. These numbers are
the same as shown in the orange table above except that the rest of the image’s
measurements are also shown. This gives you a measure of how even any lenses’
performance is at 17 locations within its field of coverage.
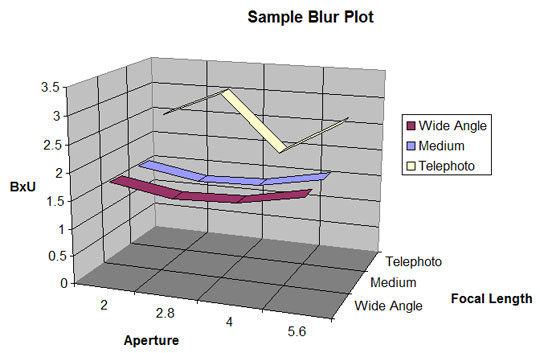
The above chart is not generated by DxO Analyzer,
but rather is generated in Excel from the comprehensive blur data. It shows
measurements taken at three focal lengths, and at selected apertures. The vertical
axis shows the Blur in BxU units. (Please note that this chart does not
relate to the example camera and lens shown in other examples on this page,
but rather a digicam with built-in zoom lens).
The propose of the chart is to provide a simple visual presentation
of a complex series of numbers. In this sample we see that this particular sample
camera / lens combination has its best resolution at wide-angle settings. Medium
focal lengths are not as good, and the telephoto end is worse, and also quite
variable.
One important thing that needs to be be borne in mind is that
since JPG images are used for these measurements the Blur measurement
is susceptible to any in-camera sharpening. This is usually user selectable
on digicams, though it may not be on some DSLRs. Too much in-camera sharpening
and unrealistic measurements can be produced. The tested numbers will look better,
but the image won’t necessarily.
A future version of DxO Analyzer will
work on RAW files, but for now this needs to be taken into consideration by
the tester and the reader. But even if RAW files are used, this won’t provide
a complete solution because some cameras even sharpen their RAW files in-camera,
with no user control or ability to turn it off. Canon has confirmed that they
are one of the companies that do this.
The French magazine Chasseur d’Image,
which has also adopted DxO Analyzer for their testing,
has decided to test cameras using each camera’s default sharpening setting,
whatever that may be. On the other hand I have decided to set in-camera sharpening
to the lowest possible level during testing. Therefore this is one measurement
where a direct comparison of test results between test sites will not correlate.
__________________________________________________
In Summary
There’s obviously a lot here to digest. Take your time, review
all of the examples, and then refer back to the lens or camera system test on
this site that you’re interested in. Be sure that you understand what the tests
are measuring. Also, beware of some of the caveats above.
Also remember that most optical tests will vary considerably with aperture.
Lenses are softest and show lowest contrast wide open. They sharpen up and show
reduced vignetting and CA as they are stopped down, but then other optical degradation
such as diffraction effects start to become bothersome as apertures become smaller.
Photography is about compromise.
__________________________________________________
Remember
All lenses and digital camera systems are compromises. One has
to balance off price, against features, against performance. One may find an
optically superior lens that has poor dust sealing, or that falls apart under
hard knocks. A digital camera or back may have superb characteristics but cost
as much as a car, putting them out of reach. Conversely, sometimes inexpensive
systems can provide tremendous value for the money, showing measurable but not
necessarily visible differences in image quality.
And, even the best performing systems when it comes to optical
tests may be dogs when it comes to how well they handle in the field, or how
well supported they are by the company that makes them. Don’t use these test
results as the sole arbiter of a camera or a lens’ goodness. There’s more to
photography than lens tests!
__________________________________________________
A Final Word
Invariably there will be readers who find fault with these tests.
Before putting pen to paper (or fingers to keyboard), consider the following…
— DxO Analyzer was created by
highly talented PhD-level mathematicians, optical experts and software engineers
over many months, in consultation with industry experts and national testing
organizations.
— If you have the educational
background and subject expertise to differ with this system’s test methodology
you may wish to contact the company with your comments. I’m sure that DO
Labs will be pleased to
hear from you, and to answer any questions that you may have.
— While operator error is of
course possible, my experience shows that the software always
catches faulty testing procedures. Every test result is Quality Assessed by
the software before results are generated.
— Results from DxO Analyzer
can not be directly compared to those produced by other testing systems or procedures.
Just as different manufacturer’s MTF charts can not be compared due to differing
test methodologies.
— These test results are self-consistant.
That is, the same test done of the same camera / lens,
when done repeatedly over time, produce nearly identical results.
— Comparisons with data produced
by other testers of similar equipment appears to yield
very similar, though not always identical results. This is likely due to sample
variations between products.
At this time (February, 2004) DxO
Analyzer is in pre-release, and S/N measurements are based on the average luminance
level of the test image.
This means that it is not possible to accurately compare cameras whose test
shots were made at different luminance levels.
A new test methodology that produces S/N measurements at a range of luminance
levels is being developed.
— While the majority of the
charts produced in these reports are generated directly by DxO Analyzer,
and are reproduced here without alteration, some 2-D and 3-D Excel-based charts
are generated by me from measurement data.
I take sole responsibility for any errors of omissions that may be found in
these.
Do not confuse DxO Analyzer with DxO
Optics Pro.
The product explained on this page, Analyzer, is designed to measure optical
performance,
and to produce test results from those measurements. Optics Pro is a product
for photographers to use
that corrects various forms of optical defects found in digital cameras, and
lenses.
__________________________________________________
DxO Analyzer Test Results
![]()


Elevate Your Vision


You may also like