


Introduction and Summary Findings
To judge from the various threads in discussion forums and web reports with performance tests, the arrival of the latest crop of DSLRs has generated a renewed flurry of interest in the subject of two big factors determining image quality: noise and resolution. It’s natural – one wonders whether new technology really allows, say, cramming 21 million photosites within a 24*36mm rectangle at tolerable noise levels, or whether the engineers cleverly designed processing algorithms which “simply” smooth out the noise at the expense of image detail, or whether there’s an optimum combination of both things happening. We don’t know the “whys and wherefores” within the camera, but we can look systematically at the results. Noise and detail are the flip sides of the coin because noise can obscure detail, as can noise-reducing firmware and software. Lens aperture and exposure technique also affect apparent resolution, therefore one needs to examine these as well in relation to noise and resolution.
Money really helps concentrate the mind, so after plunking-down 8000 bucks for a 1DsMarkIII (1Ds3), testing it at ISO 200 with the High Tone Priority1 (HTP) option enabled and seeing slightly “grittier” results in the three-quarter tones than expected for this ISO, it invited exploring the related issues of noise and detail more generally. As for HTP, we’ll dispense with that first –the manual says that by enabling HTP “noise in the shadow areas may be slightly more than usual”. So this is turned off (with confidence we can manage tonality in Camera Raw [ACR]); all the following discussion assumes HTP is disabled.
Here are the five conclusions emerging from this exploration:
-
(1) The 1Ds3 and the Nikon D3 are superb performers in respect of both noise and resolution, judged from Super A3 size real-world photographs2 printed on high DMax media in an Epson 3800.
-
(2) That said, correct digital exposure technique (Expose to the Right – ETTR) is a must for achieving optimal results.
-
(3) The noise you see on a display may or may not be a reliable indicator of noise you will see in a print, depending on the size of the print.
-
(4) Beyond a certain threshold in the lower noise range, the noise measurements from noise reduction software is a useful indicator of noise you will see in a print.
-
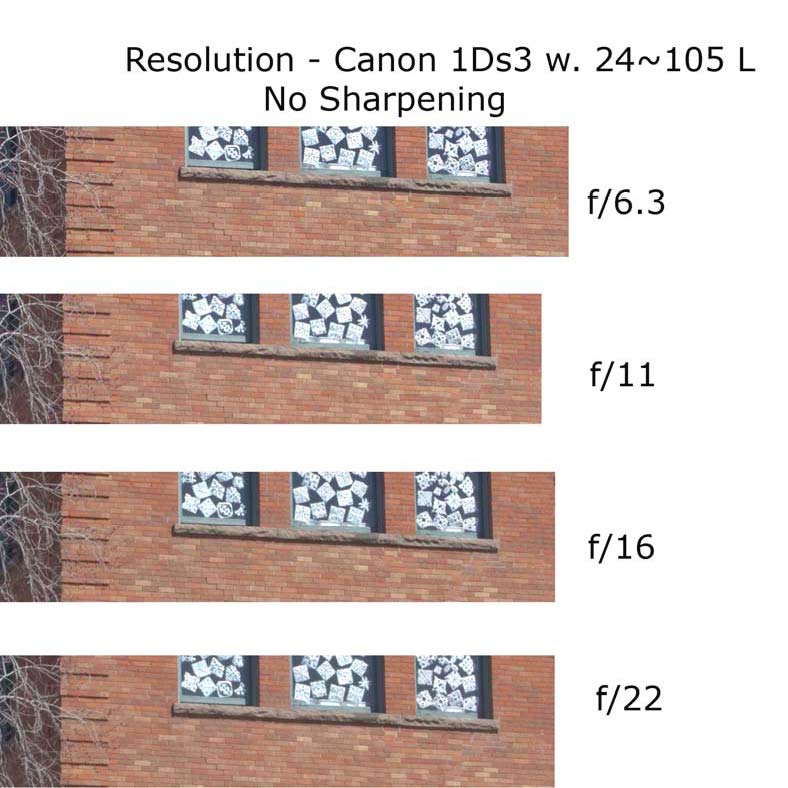
(5) Using the Canon 24~105 f/4 L lens, resolution visibly deteriorates relative to the “sweet range” when the aperture is narrowed beyond f/11, but sharpening mitigates it.
If that’s all you want to know, you may click out. If you are interested in the details, please read on.
1 HTP, according to the manual “Improves the highlight detail……….the gradation between the grays and
the highlights becomes smoother.”2 A real-world photograph is a picture of anything other than test charts and resolution diagrams.
Before testing anything, one must be clear about what one is testing for (noise and detail), how to do it and how to evaluate what one has done. The latter is particularly difficult because apart from the world of test-charts and instrument-based measurements, judgments about noise and detail as they affect the appearance of real world photographic prints (our interest) are rather qualitative, and depend on image size and viewing distance. One can be aided by the measurements created with image-specific noise profiles made in applications such as Noise Ninja and Noiseware3. As for detail, we have no interest in photographing resolution charts. We prefer to photograph subjects with fine detail (near and far) and look at how well camera and lens, (with or without sharpening in ACR and/or Photoshop), render them. All the images discussed in this paper are made with the Canon 1Ds3, the Canon 1Ds (for comparison) using the same Canon 24~105mm f/4 L lens, and the Nikon D3 using the Zoom Nikkor VR 24~120 mm lens.
If the end product is usually a print, it can be insufficient to only evaluate noise and resolution on a display4. We find that the display image, probably because it’s transmitted light, seems to reveal more stuff that may look like artifacts (especially at magnifications from 50% upward) than visible in smaller prints, though there is less of a disconnect between the display image and the print when viewing larger prints; as for revealing image detail, an Epson 3800 most likely out-resolves most of our display.
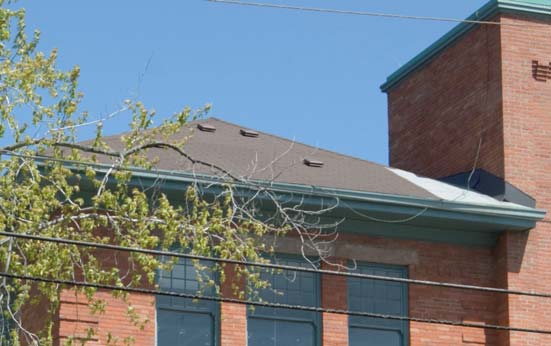
Our test-bed is the Hillcrest Community Centre because the scene has the combination of light, shadow, fine detail and open sky (around 2:30~3:30 PM on those rare comfortable, sunny, cloudless Toronto days) needed for this work.
Figure 1. The Hillcrest Community Centre, Toronto
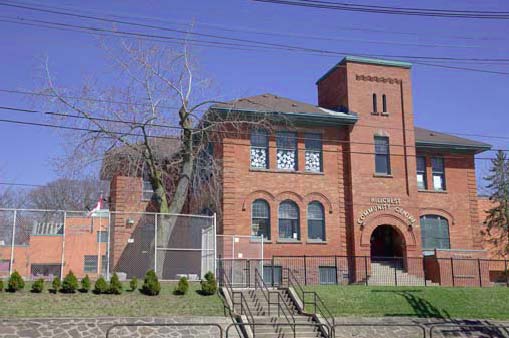
(Canon 1Ds Mk3; f/6.3 ISO 200 @ 45mm)
The testing was in four phases. Phase 1 is to see the Airy disc effect5, the purpose being to determine whether the choice of aperture could have a significant impact on our appreciation of how noise affects image clarity; in Phase 2, we explore differences between correct exposure seen with the in-camera histogram, versus the Camera Raw histogram6; in Phase 3, we assess the impact of ISO and exposure technique on the appearance of noise in images, and in Phase 4 we deal with noise reduction, sharpening and prints.
3 Even with these applications the correlation of their measurements with one’s visual observations is not
always consistent for a number of reasons, but the measurements help to make indicative comparisons.
4 ….even high resolution displays of the kind we are using: Lacie 321, Apple Cinema.
5 Named after George Airy, this is the effect of decreasing resolution with narrowing lens aperture beyond
the lens “sweet range” due to the diffraction of light within the lens.
Phase 1: The Airy disc effect
This is tested with the Canon lens only on the two Canon bodies – we expect similar effects to apply for the Nikon. We made four images with the 1Ds at f/7.1, f/11, f/16 and f/22 at about 45mm, ISO 200, using ETTR for maximum image quality, as discussed further below. With an f/4 maximum aperture this range provides evidence from within the “sweet range” (about 1.5~2 f/ stops from maximum) onward over narrower apertures. The extracts in Figure 2 show that beyond f/11 apparent resolution deteriorates.
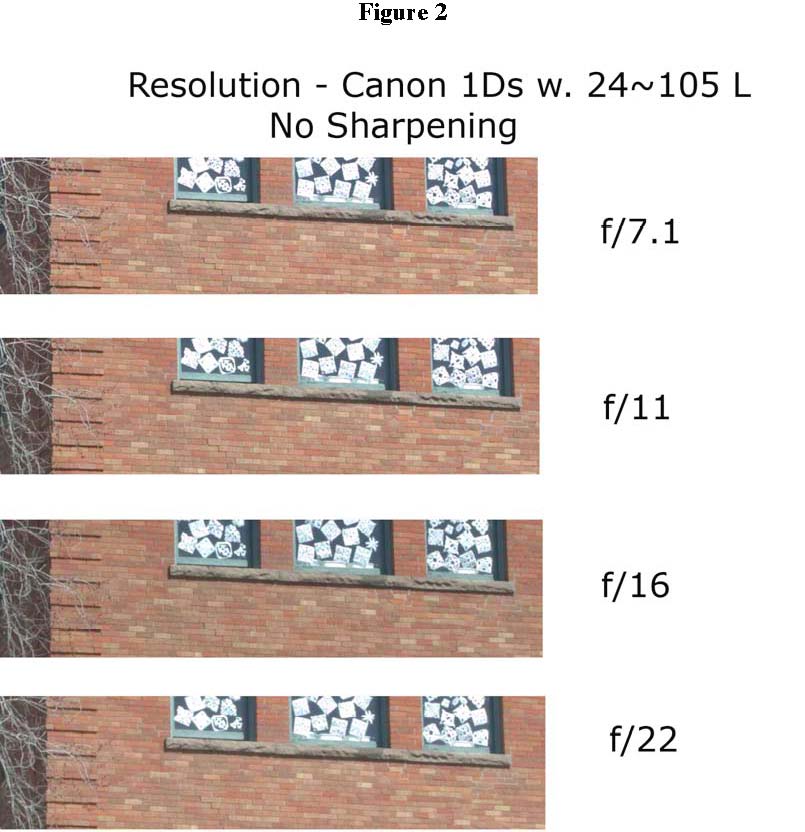
6 CR settings are zero for everything in the Basic Tab except White Balance which is “As Shot”, linear tone curves (Parametric and Point) and zeros in all folders of the HSL tab; sharpening OFF.
Figure 3 shows the same comparison7 this time for the 1Ds3 and leads to the same conclusion.
Figure 3
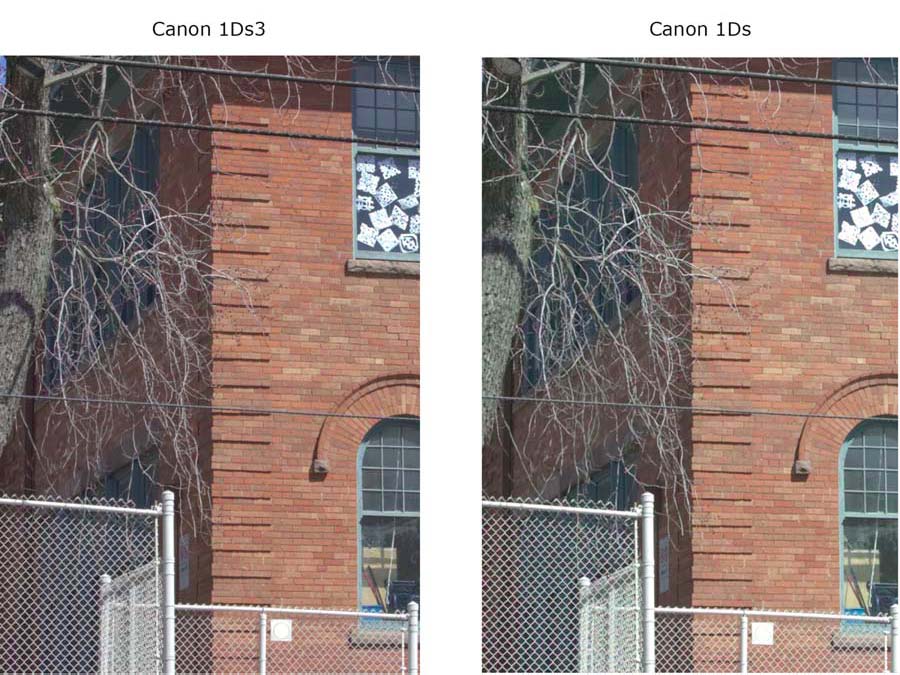
In Figure 4 we compare the apparent resolution8 of ETTR ISO 200 exposures between the 1Ds3 and the 1Ds at 45mm, f/6.3 and f/7.1 apertures respectively. These results are shown in Figure 4. This comparison indicates that the apparent resolution between the two camera models is very close9 – interesting as the 1Ds3 combines 38.2% higher resolution10 with a smaller pixel pitch.
7 In this series the widest f/ stop is 6.3 rather than 7.1 – an oversight which has no impact on the test.
8 “Apparent resolution” is what you can see without a loupe, which, using the same lens, varies according to the sensor, the medium (e.g. monitor, type of print), the magnification and the viewing distance.
9 We note the slight difference of hue between the two shots. There was no manipulation of hue, saturation or luminance in either ACR or Photoshop, but the pictures were taken about 45 minutes apart, so the light would have changed a bit. It is also possible that the two sensors record light a bit differently between the three primaries, or the ACR rendering is not identical between the profiles for the two cameras.
10 From the Photoshop Image Size dialogue, 1Ds pixels (width) = 4064; 1Ds3 = 5616 (these values can be derived multiplying the square root of the camera’s megapixels by the square root of its aspect ratio); or seen otherwise, e.g. at a 12 inch image width the 1Ds3 provides 468 PPI and the 1Ds 338.7 PPI.
Figure 4
Resolution of the 1Ds3 and 1Ds Compared (No Sharpening)
Phase 2: Expose to the right (ETTR), Expose to the Left (ETTL)
The histogram we see on the camera display is a JPEG rendition of the raw data. The resulting tonal distribution depends partly on the user-defined in-camera JPEG settings and partly on the manufacturer defined in-camera JPEG processing characteristics, which differ between camera models. When the image is opened in Adobe Camera Raw (ACR), the tonal distribution of the ACR histogram depends on the in-built ACR profiles for each camera model, the user-defined colour space settings and user-defined default settings for all of the ACR controls affecting brightness, contrast, hue and saturation.
We are testing a hypothesis that exposure affects apparent noise. The underlying reasoning is that for any given scene, signal-to-noise ratios are lower at lower exposures than at higher ones, hence by under-exposing the image and then brightening the under exposed levels in ACR or in Photoshop, the noise would become more apparent.
To do this testing, for starters we wanted a reasonably close approximation of ETTR and ETTL which clip neither (non-specular) highlights nor dark tones in ACR; therefore, we first had to test what amount of in-camera exposure compensation (EC), if any, would be needed to produce a raw file conforming to a “neutral ACR” histogram of a reasonably correct ETTR and ETTL. In this context, a “neutral ACR” histogram is produced with the settings described in footnote 6. Once we know the applicable EC (if any) to achieve ETTR and ETTL for each camera, these can be set for the exposures needed to test for noise at differing ISO values, using ETTR or ETTL techniques.
Specular highlights, common in much photography, complicate exposure, the outcome depending on how the camera handles them. If the camera “thinks” these highlights should not be clipped, the remainder of the tonal values can end-up quite far to the left. However, if the camera is less “concerned” about them, the remaining values would be further to the right. Our test scene has specular highlights in the windows and on the chain-link fence, providing an ideal condition for seeing how the different cameras handle them. In our testing, we found a substantial difference of exposure characteristics between the Nikon D3 on the one hand and the two Canon models on the other. The two Canons perform similarly (but not identically) in this respect, so for brevity we’ll focus the Canon story on the 1Ds3. Figure 5 shows the ACR histograms for the 1Ds3 at ISO 200 with 0 EC, then +1, +1.67 and +2 stops EC.
Figure 5
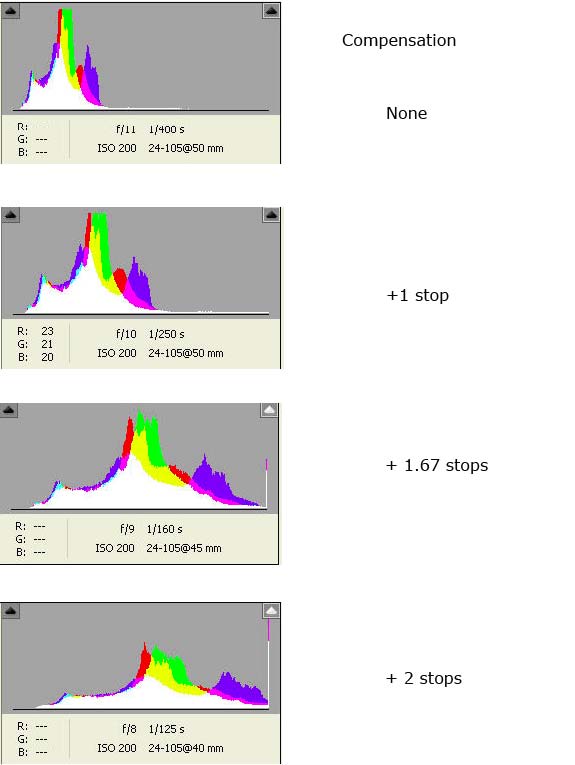
The 1Ds3 in-camera histogram (with our JPEG settings11) resembles the above ACR histograms quite closely. The camera is set to Adobe RGB colour space, Standard Picture Style and AWB. Figure 6 shows screen-grabs of the full images corresponding with the non-compensated and compensated exposures.
11 Most of the settings which affect JPEG appearance DO NOT affect the exposure of the raw file, but they do affect the appearance of the in-camera histogram which is built based on those settings.
Figure 6
ACR Exposure Compensation Results Canon 1Ds3
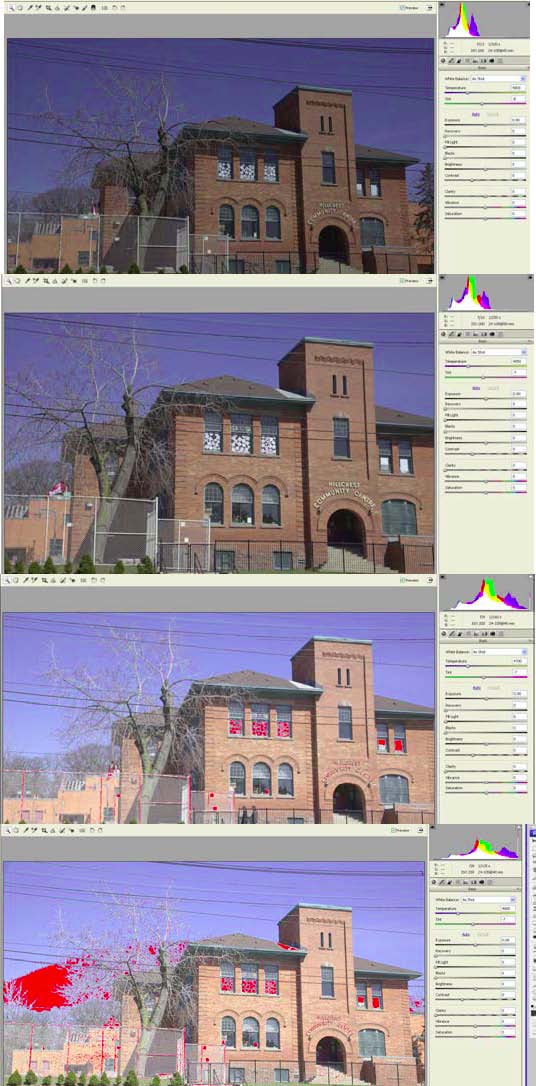 |
EC = 0
EC +1
EC +1.67
EC + 2.0
|
An exposure in the range of EC +1 to below +1.67 would be a safe ETTR for this scene. At +1.67 evidence of specular highlight clipping occurs, and by EC+2 the sky is beginning to clip. From Figure 5, the EC=0 histogram is a good ETTL.
The story for the Nikon D3 is very different. As seen in Figure 7, the ACR histogram shows an acceptable ETTR with minor specular highlight clipping at zero compensation. The whole tonal range is closer to right than occurred with the 1Ds3, which latter camera seems to have a more “conservative philosophy” with respect to protecting specular highlights. With a view to maximizing ETTR, the setting of EC +1 seemed workable according to the in-camera histogram, however at this setting – and not visible in the in-camera histogram – some sky clipping occurs which required about +20 Recovery correction in ACR. To obtain a true ETTL exposure, we found it necessary to use a setting of EC -3.0, as shown in Figure 8, whereas the Canons produced a (somewhat brighter ETTL) at zero EC.
Figure 7
Nikon D3 – No Compensation (ETTR)
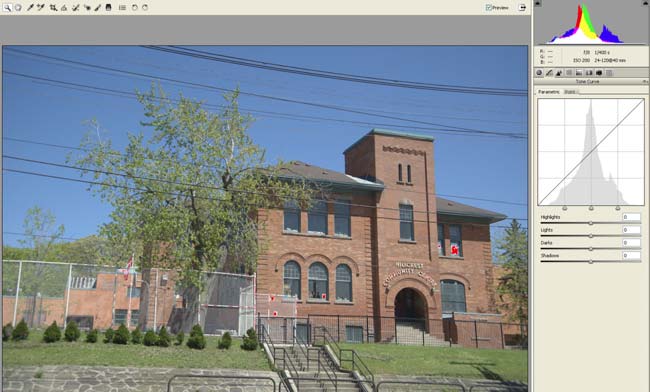
Figure 8
Nikon D3 – Compensation -3.0 (ETTL)
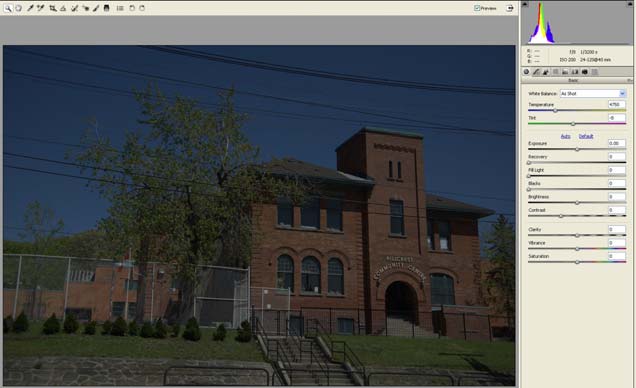
Figure 8 is indeed very under-exposed, but it took this much EC to produce an ETTL with a tiny bit of room to spare before dark tone clipping. The in-camera histogram was a quite reliable indicator of the left clipping limit.
The operational conclusions emerging from Phase 2 are that for the Canon noise evaluations using this scene, ETTR is obtained with at least EC +1.3 and ETTL with no EC; with the Nikon D3 for ETTR we adopted EC of +1 which produced no clipping on the in-camera histogram but required some successful Recovery in ACR; for ETTL we used EC -3.0 which did not clip to the left either in-camera or in ACR.
Phase 3: Observations of Noise
The image areas which tend to show noise the most are expanses of fairly uniform mid-tone and colour, such as the sky, and dark tones. Our test scene intentionally contains adequate amounts of both. The three ways we assess noise comparatively are (i) looking at it on the display, (ii) measuring it with software (e.g.Noise Ninja or Noiseware) and (iii) looking at it in prints. We cannot convey the prints in an article, but we can discuss them. Our procedure is to first adjust the image tonality in CR (using Exposure, Recovery, Brightness, Fill and Blacks) to produce a pleasing image with a normalized histogram12. Figure 9 shows such a rendition for the Canon 1Ds ETTL at ISO 1250 (the 1Ds ISO ceiling).
Figure 9
Adjusted Image – Normalized Histogram, 1Ds, ETTL, ISO 1250
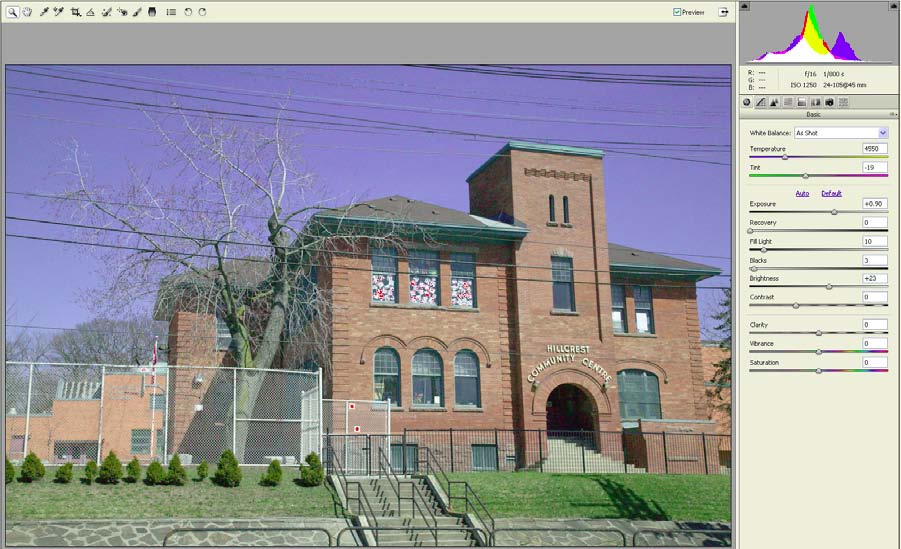
12 A normalized histogram is one which, in terms of the needs of the image, has a correct distribution of tones from darks to lights with minimal clipping at either end.
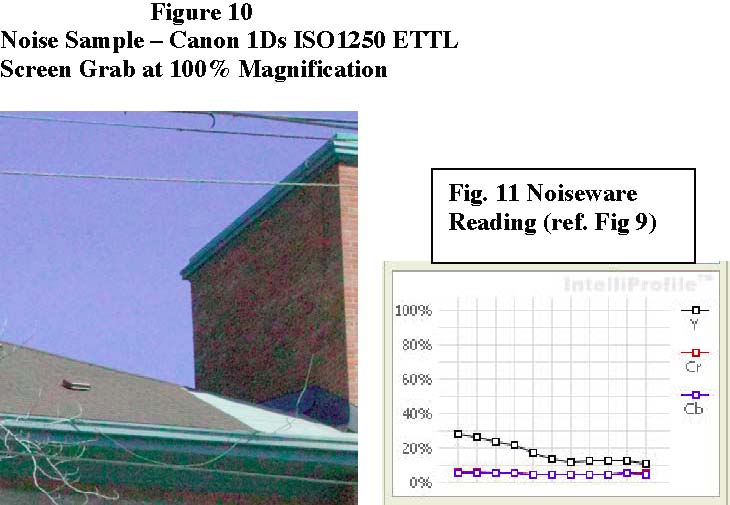
With this rendition into Photoshop (16-bit, Pro Photo), the noise in the key areas of interest looks on the display as shown in Figure 10. This is obviously quite noisy and the reading from Noiseware confirms this observation. For the image in Figure 9, the Noiseware maximum overall noise reading is about 27% (Luminance and High Frequency13) as shown in Figure 11. For this particular scene, we found that the noise measurement data is more consistent with expectations and visual appearance in Noiseware Pro than it was in Noise Ninja14, but even in this application some minor apparent inconsistencies occurred, noted in the discussion of results below.
We rendered a total of 39 images of the same scene, processing each one of them individually in Camera Raw to produce a normalized histogram with clipping confined to the extreme specular highlights and providing for about the same visual appearance (contrast and brightness) in each image. We found it adequate to limit the adjustments to Exposure, Recovery, Fill, Blacks and Brightness in the Basic Tab. We did not use Clarity, Vibrance, Saturation, Tone Curves, Sharpening or anything else in any other tab of Camera Raw, except to leave Color Noise Reduction set at the Camera Raw default of 25 for all images. Once rendered in Photoshop no further adjustments were made. The Background layer of each image was auto-profiled in Noiseware using Noiseware’s neutral settings of zero for luminosity and chroma noise detection at all frequencies, colour ranges and tonal ranges, then we read the noise curve in Noiseware’s Intelliprofile graph. Unfortunately, the size of this graph is too small to accurately see a precise value for the curve level between each 10 percentage point line on the grid15, and unfortunately, the program does not provide other numerical read-outs. Our estimates of numeric value corresponding with the curve levels are most likely accurate within a couple of percentage points, which is adequate for present purposes.
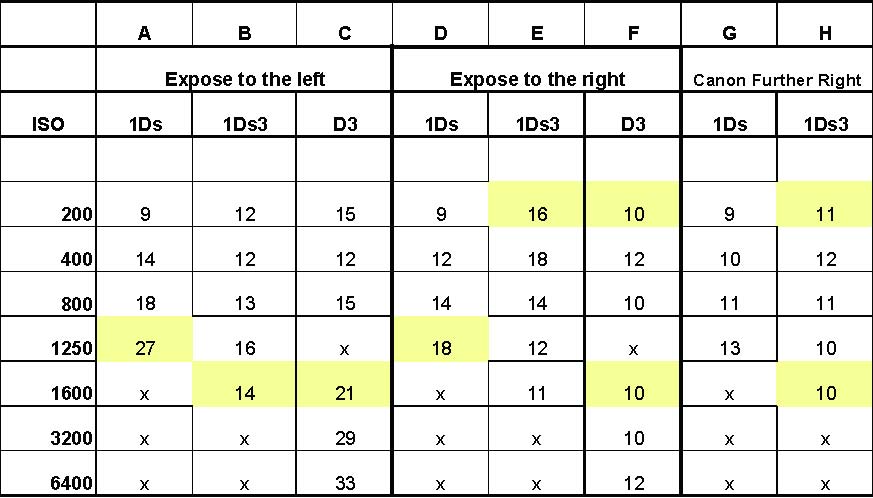
The 39 results in Figure 12 show noise readings by camera model, by ISO (up to the maximum “hard” ISO values available to each model) and by exposure technique.
13 As High Frequency is the predominant noise characteristic in all the images tested, to simplify the
comparisons we confine the measurements to the maximum values found across the luminosity spectrum
for High Frequency noise.
14 For example, in the Canon 1Ds series, the image at 400 ISO had a Noise Ninja overall index of 61
compared with the ISO 1250 image at noise index of 34. This is clearly incorrect in principle and visually.
15 The graph in Figure 11 is an enlargement from a screen-grab of the actual interface.
| A | B | C | D | E | F | G | H | |
| Expose to the left | Expose to the right | Canon Further Right | ||||||
| ISO | 1Ds | 1Ds3 | D3 | 1Ds | 1Ds3 | D3 | 1Ds | 1Ds3 |
| 200 | 9 | 12 | 15 | 9 | 16 | 10 | 9 | 11 |
| 400 | 14 | 12 | 12 | 12 | 18 | 12 | 10 | 12 |
| 800 | 18 | 13 | 15 | 14 | 14 | 10 | 11 | 11 |
| 1250 | 27 | 16 | x | 18 | 12 | x | 13 | 10 |
| 1600 | x | 14 | 21 | x | 11 | 10 | x | 10 |
| 3200 | x | x | 29 | x | x | 10 | x | x |
| 6400 | x | x | 33 | x | x | 12 | x | x |
Recapping from our discussion of exposure in Phase 2, exposure is a critical variable impacting the appearance and measured values of noise; generally the greater the under exposure the lower the signal-to-noise ratio, the more apparent the underlying noise characteristics and the higher the noise readings Noiseware delivers.
We discovered that using ETTR most effectively for minimizing apparent noise in this scene really means tolerating some clipping of one channel, which can be recovered easily enough in ACR. This became most apparent using different ETTR settings for the Canon models, comparing columns D and E with G and H in Figure 12. Take for example columns D and H, where the exposure techniques were ETTR with EC +1.3 and ETFR (Expose to the “Further Right”) with EC +2.0, which like the Nikon produced easily recoverable sky clipping in the ACR histogram, but also unlike the Nikon also produced it in the in-camera histogram. We see here that the noise readings are higher in the ETTR results compared with those from ETFR. The Canon ETFR results are more directly comparable with the Nikon ETTR results because the resulting unadjusted images are similar in terms of positioning and clipping in ACR. For the ETTL results, while both ACR histograms (Nikon and Canon) are roughly similarly to the left, relying on the Nikon in-camera histogram we may have been a bit aggressive using EC -3, resulting in a histogram compressed a bit more leftward and looking a bit darker than the ETTL Canon exposures. This may partly explain why the ETTL Nikon D3 noise values are so relatively high upwards of ISO 1600. In general, looking at the data in Figure 12 for differences due to exposure technique, especially from ISO 800 upward, exposure technique makes increasingly large differences in the measured noise values. However, at ISO 200 and for the most part ISO 400, the noise readings are not particularly sensitive to exposure technique.
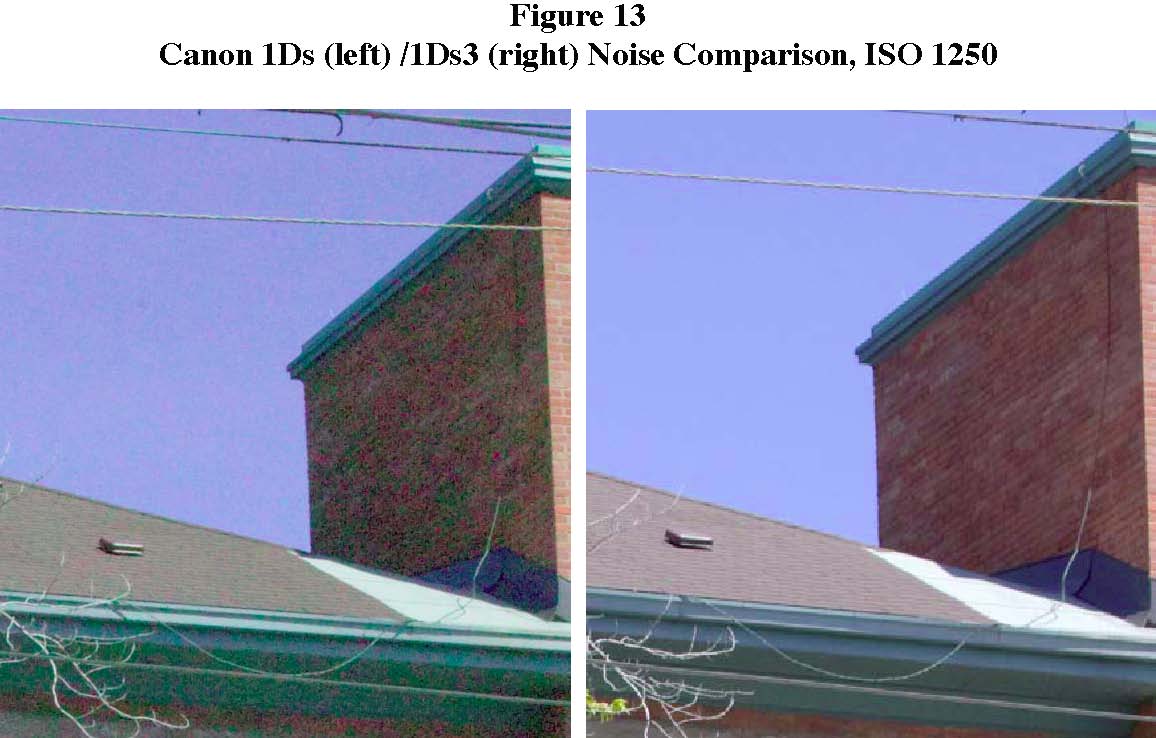
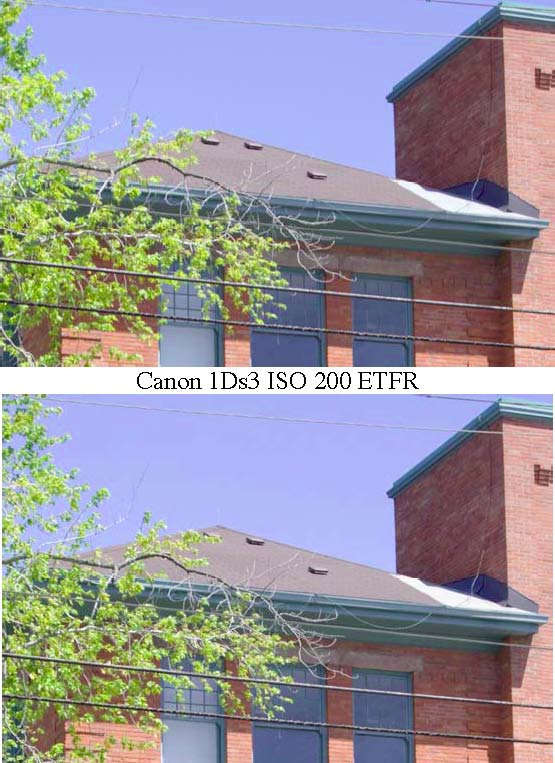
Figure 13 provides a visual appreciation of the different noise appearances between the worst Canon 1Ds result (ISO 1250, ETTL), and the best Canon 1Ds3 result for the same ISO (ETFR), also showing the visual on-display impact of the difference between Noiseware readings of 27 and 10 respectively. As expected, the 1Ds3 image is remarkably cleaner. At first blush, one may observe that much of this difference could be more attributable to exposure technique than to technical change, insofar as the noise difference between the 1Ds and the 1Ds3 is much more accentuated for the ETTL exposures than it is for the ETFR. However, technical change remains important: the 1Ds3 still provides a cleaner image than the 1Ds within the same exposure technique, and the same frame size contains about 10 million more pixels in the 1Ds3.
Much as expected, once roughly equivalent exposure techniques are used, differences of noise performance between the Canon 1Ds3 and the Nikon D3 are not remarkable, save for the very noisy results obtained from the Nikon for ETTL beyond ISO 80016. Comparing the 1Ds3 and the D3 for noise using the ETFR strategy with the Canon, the differences are insignificant.
16 We remind that the extent of under-exposure producing these results is severe.
One would expect that for any exposure technique and all three cameras, noise should increase with ISO, but this is not uniformly apparent in these tests. It happened for all the ETTL exposures (Figure 12, columns A, B, C), for the 1Ds ETTR exposures (column D) and for the 1Ds ETFR exposures (column G). It did not happen for the others: for the 1Ds3 ETTR the noise readings fell as ISO increases (column E), while noise readings hardly reacted to ISO changes for the D3 ETTR and the 1Ds3 ETFR (columns F and H).
Our bottom lines observation emerging from this phase of the work is that there has been remarkable technical progress in respect of noise over the past seven years, but exposure technique is the most critical variable for controlling noise, as indicated by on-screen appearance and measurements from noise mitigation software.
Phase 4: Print, Noise Reduction and Sharpening
Measurements and on-screen appearance are one thing – how an image looks on paper can be quite another when it comes to the visual appearance of noise and sharpening. As well, all the foregoing discussion is focused on “raw performance” without using software to reduce noise and sharpen. In this section we bring the analysis down to the real-world bottom-line of prints which photographers would make on paper after using appropriate dosages or noise reduction and sharpening. In the final analysis, what matters to viewers is the final product, however achieved.
We can’t properly convey prints in an article like this, because the sheets would need to be scanned, introducing a host of other variables to mess-up comparisons. So for prints (we made 29), readers will have to take our word for the impressions received by two pairs of experienced eyes. We can and do show the display appearance for several key comparisons before and after noise reduction and sharpening. As above, we use Noiseware Professional for noise reduction and PK Sharpener Pro Capture Sharpen and Output Sharpen for – you guessed it – sharpening.
Figure 14 is a retake of Figure 12 highlighting in yellow the cases we selected for further work here.
Figure 14: Selected Cases
This selection of nine cases takes into account noise comparisons of:
- The best and the worst
- ETTL between the cameras
- Low and high ISO
- D3 ETTR and 1Ds3 ETFR
- ETTR and ETFR for 1Ds3 at low ISO
We also printed the Phase 1 resolution tests for the 1Ds3 to see on paper how much difference the Airy disc effect makes on prints with and without sharpening.
First we print17 the files on Epson Premium Luster Photo Paper as they are – no resampling, no noise reduction and no sharpening. Then we noise-reduce (as needed) and sharpen, and compare them with sharpened non-noisy “benchmark” files.
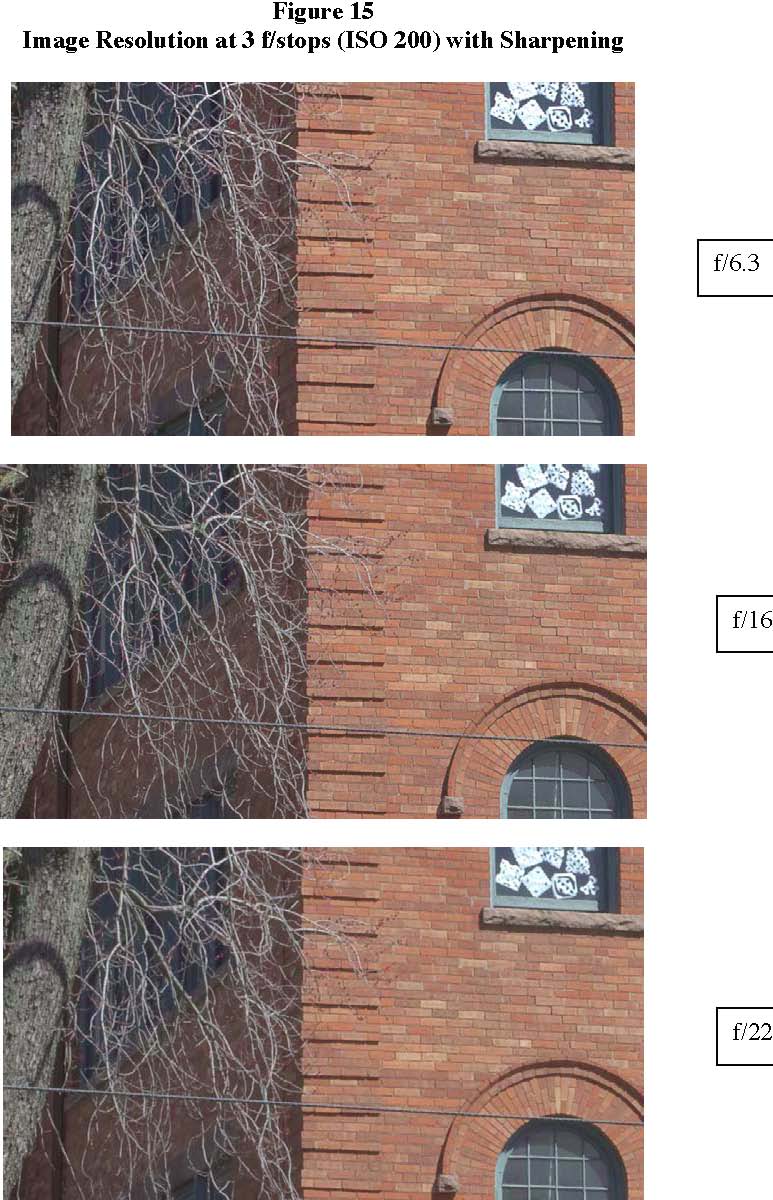
Starting with the Airy disc effect, the unsharpened prints (extracts of prints which full-size would be 23.4 * 15.6 inches at 240 ppi) largely confirm the observations we made in the Phase 1 discussion, though we find the effect is a bit subtle over the range and for the image tested. Seeing it requires some concentration, but it’s there. The distinction between these prints becomes even more subtle after they are sharpened18. If we take the f/6.3 sharpened print as the benchmark of optimum print quality, we compare it with the f/16 and f/22 sharpened prints and we find that sharpening almost compensates the difference between using f/6.3 and f/16, but does a little less so at f/22. For what it’s worth, we illustrate this in Figure 15. The general conclusions we come to for Phase I are:
(1) where there is a trade-off between depth of field and optimum resolution in the selection of an aperture, it may be preferable to narrow the aperture up to a couple of stops beyond the sweet range for preserving depth of field and count on sharpening to preserve apparent resolution, and (2) for the remainder of our work on noise, aperture (within the range we tested) is not a concerning issue in respect of evaluating the impact of noise on image quality.
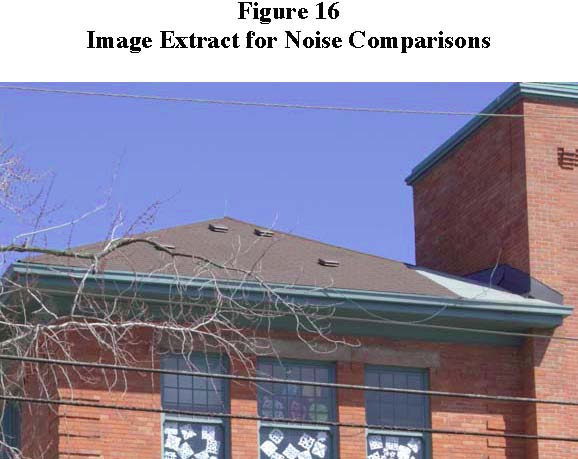
The first print for examining noise was a full-frame view of the scene shown in Figure 1 using the noisiest Canon 1Ds image (ISO 1250 ETTL, noise index 27) occupying most of an 8.5*11 inch sheet at 416 PPI. While the sky and the shadow areas look very slightly gritty at this magnification, we were surprised to see how “not too bad considering” this image looks and decided the magnification is too small for reliable comparisons of the type needed here. Therefore we used a non-resampled extract of the image as shown in Figure 16. This reproduces a small segment of the image magnified to about 4.5*7 inches at 180 PPI for the Canon 1Ds and Nikon D3 files and 240 PPI for the 1Ds3 files. These are adequate for making noise and sharpness comparisons.
17 Epson 3800 printer using Epson Ultrachrome K3 inks, single pass, 1440 dpi with Photoshop Color Management, using the Epson driver version 5.5.1 and the Epson profile for Premium Luster Photo Paper.18 For sharpening we used PK Sharpener Pro Capture Sharpen at the Superfine setting with default layer opacities, then Output sharpening for High Resolution Inkjet at the corresponding image resolution and default layer opacities.
The three noisiest images printed (ETTLs from the1Ds, 1Ds3 and D3 at ISO 1250, 1600 and 1600 respectively) look noisy on paper, as they do on display. Noise reduction and sharpening improved the two Canon images substantially, but less so for the Nikon, where the noise pattern was particularly pronounced, even though its noise index is below that of the Canon 1Ds at 1250 ISO. The only conclusion from this set of comparisons is that making photographs with ETTL at high ISO is generally a bad idea, even with the help of noise reduction and sharpening.
Whether at ISO 200 or ISO 1600, it is hard to see in either the unsharpened or sharpened prints a significant difference in image quality between the ETFRs from the Canon 1Ds3 and the ETTRs from the Nikon D3, and none of these prints were noise-reduced because their noise indices were in the range of 10-12 (Figure 17). We think this is a remarkable observation underscoring both the huge amount of technical progress and the importance of exposure technique to achieving this outcome.
We found that noise-reducing and sharpening the old Canon 1Ds ETTR 1250 ISO image improved it considerably, but the sky remains not quite as clean as it is in the ISO 1600 ETTR and ETFR versions from the D3 and 1Ds3. While the new technology delivers better results, properly used, the old work-horse still gallops (but more slowly!).
A special word needs to be said about the Nikon D3 results for the ISO 3200 and 6400 ETTR images, which are in a category of their own as there is no Canon comparator. They have noise index readings of 10 and 12 respectively. Both on display and printed, the ISO 3200 image does not exhibit a need for noise reduction. On display, the ISO 6400 image showed slight evidence of noise, therefore we printed it, and on paper it showed just a bit more. With noise reduction and sharpening, this image rivals the ISO 1600 result. This is remarkable considering the ISO speed.
Figure 17
ISO 200 and ISO 1600 (ETTR/ETFR) Compared
Canon 1Ds3 ISO 1600 ETFR
Nion D3 ISO 1600 ETTR
The up-shot of all this is that with good exposure technique the new breed of DSLRs provides ample leeway to increase ISO without the need to worry about noise reduction.
This is good to know, because it provides flexibility to use higher shutter speeds or narrower apertures while maintaining very good image quality.
Summarizing our overall findings, best practice suggested from this evidence is first and foremost ETTR, for the 1DS3 and the D3; using ETTR/ETFR technique, ISO values up to at least 1600 are very workable, and it is best to avoid apertures more than a couple of f/stops narrower than the “sweet range”.
Mark D. Segal. June, 2008
Michael Reichmann provided valuable advice, feedback, very keen eyesight and his Nikon D3 during the preparation of this article. – MDS
Elevate Your Vision


Read this story and all the best stories on The Luminous Landscape
The author has made this story available to Luminous Landscape members only. Upgrade to get instant access to this story and other benefits available only to members.
Why choose us?
Luminous-Landscape is a membership site. Our website contains over 5300 articles on almost every topic, camera, lens and printer you can imagine. Our membership model is simple, just $2 a month ($24.00 USD a year). This $24 gains you access to a wealth of information including all our past and future video tutorials on such topics as Lightroom, Capture One, Printing, file management and dozens of interviews and travel videos.
- New Articles every few days
- All original content found nowhere else on the web
- No Pop Up Google Sense ads – Our advertisers are photo related
- Download/stream video to any device
- NEW videos monthly
- Top well-known photographer contributors
- Posts from industry leaders
- Speciality Photography Workshops
- Mobile device scalable
- Exclusive video interviews
- Special vendor offers for members
- Hands On Product reviews
- FREE – User Forum. One of the most read user forums on the internet
- Access to our community Buy and Sell pages; for members only.
You may also like