


By Mark Segal
Click to Download This Spreadsheet
You Also Require Microsoft Excel or a Compatible Spreadsheet Program
There are a number of factors to be considered when buying a new camera. Just a few include – image quality, resolution (pixel count) and price. In addition there is the matter of lens availability, ergonomics, features and much, much more.
Some factors lend themselves to analysis and reading – such as technical specs and feature lists. The many available web reviews are quite handy for this. Other factors such as ergonomics and “feel” are highly subjective and really require a visit to a dealer and a hands-on session.
But it’s the first three mentioned – image quality, resolution (pixel count) and price which figure most prominently for serious photographers. How then does one make sense of the relationship between these factors?
DxOMarkprovides a means of objective comparison between between various tested cameras. But, these numbers are irrespective of resolution (pixel count) and price. How then does one take all three factors and turn them into a buying decision?
Mark Segal, an economist by profession and a photographer by avocation has a solution to share with us in the form of an Excel spreadsheet which factors all three together.
– Michael Reichmann
______________________________________________________________
This tool is a user-friendly interface designed to help you select the right camera for you. It canâ��t make your decision – it can only help. The choice of a camera should include many more considerations than those which we can configure here. This tool focuses on three objective factors which we think are important elements entering into a purchase decision: price, resolution and sensor quality. Our tool shows you comparative information on each of these factors for each camera, allowing you to compare two at a time.
You may download the toolhere. It is an Excel Spreadsheet, compatible with all versions of Microsoft Excel from at leastExcel 97onward, and perhaps other spreadsheet applications. To use it, you only need to know how to enter a few numbers on the page, which we explain below. Here is a picture of the first few lines of the database:
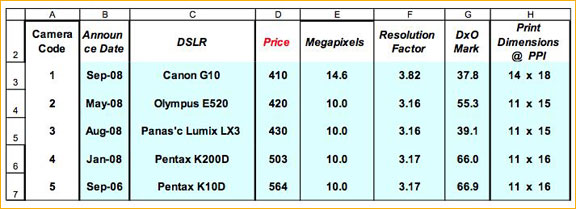
There is a bewildering choice of cameras with many different specs and prices, so this tool is a contribution to help focus on key measurable fundamentals in a systematic way. At present, our database includes 24 models ranging in price from about $400 to $8,000. They were selected because they are representative of their class or because they have features of special interest. This is only intended to convey a way of thinking, not to be a complete inventory of everything you could buy. Whether or not a camera is included here makes no statement about its suitability as a purchase candidate. We will add models to this inventory as new cameras of interest reach the market or, depending upon the details, in response to our readers� requests. We have decided not to include medium format backs for the time being because they raise special questions of comparability discussedhere.
Our camera price data in column D comes from the B&H website, in US dollars, for the body alone, except for several cameras where the lens is fixed or in one case only (Nikon D60) – part of the most basic package. Because you may be facing different pricing conditions, you may change the prices in this sheet by simply highlighting the price which is now there, and typing in the price you face. Make sure to change ALL the prices of interest to you, otherwise the comparisons you draw will be misleading for the price dimension. Weâ��ve developed some price ranges (colour-coded) for your convenience; they have no operational significance.
Our resolution data is derived directly from the number of megapixels on the sensor shown in Column E. The resolution factor in Column F relates directly to the number of megapixels in Column E and is the basis for deriving the maximum print dimensions in Column H (at your selected pixels per inch (PPI) value, without resampling). The importance of this information is that it tells you how large an image you can make using the whole frame, or how much head-room you have for cropping while making lower-size prints without resampling. The derivation of the resolution factor in Column F and the print dimensions in Column H uses a bit of arithmetic explained inAnnex 1. By the way, we donâ��t wish to convey an impression that images cannot be successfully resampled – they can be, and that adds a percentage of headroom on size and cropping, the amount depending on how much you resample.
The �DxO Mark� in Column G is the overall rating for each camera model in the DxOMark data base.The DxOMark websiteprovides extensive information on how these numbers are derived. They include factors such as Low-Light ISO, noise, colour depth and dynamic range. As such they provide a quite comprehensive, systematic comparative benchmark for quantifying sensor performance. We use the DxO Mark and the Resolution Factor as our two indicators of image quality.
Let us now turn to using our camera selection tool. The two things you may want to look at first are price and resolution – how much money can you spend, and how big do you want to print. Then within those values, which camera is likely to provide a better quality image.
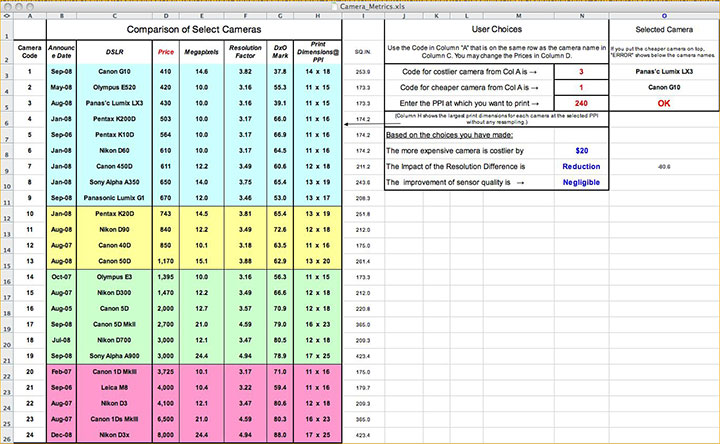
Once you are done with any changes to the price information, you only enter three numbers in the control panel (illustrated below) and the results of your selections appear just below it. The control panel allows you to compare price and quality (as we define it here) between any two cameras in the database, one being costlier than or the same price as the other.
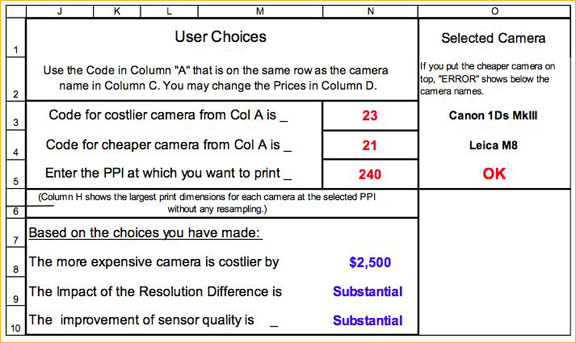
The only numbers you need are the three red ones in Column N. The two upper ones (numbers 23 and 21 in the illustration above) are the Camera Codes in Column A (see the first illustration above) which select the corresponding camera model of interest. Highlight cell N3 and type in the Camera Code for the costlier camera. Highlight cell N4 (just below N3) and type in the Camera Code for the cheaper camera you wish to compare with the costlier one. When you type in the codes, the names of the models you have selected appear to the right of the code you typed. Please check them to make sure this is what you wanted to select. So, in the example above, we selected camera 23 (Canon 1DsMkIII) as the costlier camera, and camera 21 (Leica M8) as the less costly one. Because we have correctly put the costlier camera on the upper row and the less costly one underneath it, we get a red �OK� message in cell O5. Had we reversed these entries by mistake, that cell will return a red �ERROR� message, and you must correct it to get valid results.
Unless you really feel strongly about printing at higher resolution than 240 PPI, we recommend leaving that value as is, but this is up to you – you can select any PPI for cell N5 which suits you, and the resulting maximum print dimensions (without resampling) will show in Column H, to the left of the control panel. We suggest remaining within a range of 180PPI to 360 PPI for this value. The PPI entry and the results of Column H are only for your guidance in selecting models to compare, and have no impact on the key results discussed just below.
Once youâ��ve made these three choices, look at the results immediately underneath, in blue. In our example above, they tell you that for an extra $2500 you can have a camera (Canon 1DsMkIII) whose resolution advantage relative to the Leica M8 is â��Substantialâ�� and whose improvement of sensor quality is also â��Substantialâ��. Thatâ��s good to know, and thatâ��s as far as our little exercise takes you. From here onward, â��Itâ��s up to you” – your judgment and your needs take over. More generally, we have five qualitative levels to distinguish the difference between one camera and another in respect of Resolution and DxO Mark. These are â��Reductionâ�� (meaning a worse result for the more expensive camera compared with that of the cheaper one), â��Negligibleâ��, â��Slightâ��, â��Moderateâ�� and â��Substantialâ��. Thesecond Annexdiscusses the derivation of these ranges.
Faced with an extra $2,500 of expenditure, the first thing we would ask ourselves is whether we intend to make prints larger than 11X16 inches and whether 11X16 inches at 240 PPI provides enough head-room to crop pixels, while still allowing us to print as large as we want at the PPI we want. If the answer is �yes�, (and especially if we don�t mind some resampling) that�s �strike one� against buying a Canon 1Ds MkIII.
Then we would look at the DxO Mark for these two cameras in Column G. Here we would see that the Canon has a high score of 80.3 and the Leica a lower score of 59.4. This doesnâ��t mean the Leicaâ��s image quality is 25% worse than Canonâ��s. In fact, when used within their appropriate ranges of resolution and depending on the ISO, both cameras deliver fine image quality. In this case, the comparative DxO scores could reflect mainly differences in the impact of noise at different ISO â��speedsâ��. So should you spend the extra $2,500? Neither this tool nor we can tell you that. We would trot down to our friendly retailer with our memory cards, try both cameras in the shop at lower and higher ISO values, take the cards home, print the images and see for ourselves what kind of image quality differences hit us in the face – if they do, and what meaning that has relative to our requirements.
Apart from what this tool shows, there are numerous other factors which should influence a purchase. In our example above, one is a relatively heavy DSLR, the other isn�t. They have a very different form factor and feel in the hands, they have different features and controls, etc. Speaking more generally, some cameras are better weatherproofed than others, and one pays for this.
You can make many interesting comparisons with this tool, and we hope it helps you work your way through a selection process if you are of a mind to buy a camera, or if you would like to get some perspective whether what you bought made sense (on this basis), or if you are just curious about what you may be getting or not getting for some fairly hefty price differences between cameras.
______________________________________________________________
Annex 1
Calculating the Resolution Factor
The sensor contains a two dimensional array (width and height) of photosites translating to pixels. So, for example, a square 1 megapixel (MP, one million pixels) sensor would have 1000*1000 pixels on each dimension (a thousand times a thousand is a million). Given the number of MP, we want to derive the number of pixels on each dimension. This can be done with a rectangular sensor for the long or short dimensions using the MP count and the Aspect Ratio (AR). The AR is the sensor�s ratio of width/height. For example, with the full-frame 35mm camera dimensions used in some DSLRs, the aspect ratio is 36mm/24mm = 1.5. The formula for extracting the longer linear number of pixels from the MP count is:
SQRT(MP)*SQRT(AR)*1000, and for the shorter dimension:
SQRT(MP)/(SQRT(AR)*1000,
where SQRT means �square root�.
Let us apply this formula (longer dimension) to the Canon 1DsMkIII, which is a full-frame sensor with AR = 1.5, and 21 MP:
SQRT(21)*SQRT(1.5)*1000 = 4.583*1.225 * 1000 = 5613 pixels.
Applying the formula to derive the shorter dimension for the same sensor,
SQRT(21)/SQRT(1.5)*1000= 4.583/1.225 * 1000 = 3741 pixels.
Hence based on the MP and the AR, we have calculated the camera�s native pixel dimensions of 5613 * 3741[1].
Now, moving from linear pixel dimensions to linear resolution in a print, for each dimension we need only divide the linear pixel count by the number of pixels per inch (PPI) at which we will print. So, following on with this example, with no cropping and no resampling we could make a print = 5613/240 by 3741/240 = 23.4 inches by 15.6 inches, as shown rounded in Column H of our database.
Taking this one step further, what happens if we wish to crop or resample?
For this sensor we could, for example, delete half the pixels in the image file (say by cutting the long dimension in half) and still make a print that is about 11.7*15.6 inches at 240 PPI. (Not bad.)
Then if we wanted a bigger print of this same cropped image we could enlarge it in Photoshop using the Image Size function either by reducing PPI without resampling, or by leaving the PPI intact at 240 and resampling with Bicubic Smoother (which Adobe recommends because we would be expanding pixel dimensions), or by some combination of the two. It is another subject to get into which technique is better. Here we are dealing only with dimensions. Reducing PPI from 240 to 180 without resampling increases the image dimensions to 15.6 by 20.8 inches (i.e. a 25% reduction of PPI yields a 33% increase of linear dimensions). The same linear dimensions could be had by resampling at 240 PPI if we preferred that approach.
______________________________________________________________
Annex 2
The Results Ranges
All the results are based on DIFFERENCES between the more and less expensive cameras chosen for comparison. The price difference has no range and no qualitative assessment because the importance of a price difference is subjective, varying greatly from one person to the next.
We can and do say more, however, about the meaning of the quality differences – being the Resolution Factor and DxO Mark. The ranges for each qualitative level of difference (from â��Negligibleâ�� to â��Substantialâ��) are based on judgment and experience – we think they are reasonable but there is nothing â��hard and fastâ�� about them.
(1) The Resolution Factor
To derive the range markers for the Resolution Factor we first looked at the total possible size of the Resolution Factor range from the smallest to the largest value in the database. Then given all the intermediate Resolution Factors, we looked at their corresponding incremental size of prints one could make at 240 PPI without resampling, moving from one level of print size to the next, and set the differences accordingly.
None of these cameras are less than 10 MP or more than 24.4 MP, corresponding with Resolution Factors of 3.16 to 4.94 respectively, or a total incremental Resolution Factor range of 1.78 between the least and the most, corresponding with print dimensions in a range starting with approximately 11*15 inches increasing to 17 * 25 inches or more exactly from 173.3 sq. in. to 423.4 sq. in. We composed these range boundaries using differences of square inches, because this metric facilitates comparison by avoiding the issue of AR differences between models. Within this total incremental range of 1.78 for the Resolution Factor, we established the following intermediate range boundaries, for which we provide examples in the table below indicating how the Resolution Factor differences relate to the Impact judgment for each level of impact:
Impact
Cameras
Res Factor
Difference
Sq. In.
Comparison
Sq. In.
Difference
0 to 0.32
Negligible
Sony A350
Canon 450D
0.26
243 vs 211
32
0.32 to 0.64
Slight
Canon 5D Canon 40D
0.39
221 vs 175
46
0.64 to 1.35
Moderate
Pentax K20D Olympus E520
0.65
252 vs 173
79
1.35 onward
Substantial
1Ds MKIII Leica M8
1.37
365 vs 180
185
(2) The DxO Mark
The DxoMark ranges from a minimum value of 37.8 to a maximum of 88, the size of the total incremental range being about 50 points. The differences of visual impact related to varying differences between one DxO Mark and another is non-linear and not possible to benchmark in a manner as objectively tangible as we could for the Resolution Factor. It takes someone who has considerable experience with a wide range of cameras and their image quality performance to make these judgments. Michael Reichmann provided the following guidance for correlating Impact levels with intermediate ranges of DxO Mark:
Negligible
Slight
Moderate
Substantial
Range of Differences between two DxO Marks
0 to 3
3 to 6
6 to 12
12 upward
Mark D Segal (*)
Toronto, February 2009
______________________________________________________________
(*) The initial impetus and first draft development of this kind of comparative spreadsheet integrating price and quality across a range of cameras came to us from Mr. Terry Wyse, a highly regarded Color Management consultant based in the Charlotte, North Carolina area (www.wyseconsul.com). Michael Reichmann provided valuable guidance on the structure of the user interface.
[1]The specified values are 5616 x 3744, thus a very slight rounding error here relative to the published specs.


Elevate Your Vision


Read this story and all the best stories on The Luminous Landscape
The author has made this story available to Luminous Landscape members only. Upgrade to get instant access to this story and other benefits available only to members.
Why choose us?
Luminous-Landscape is a membership site. Our website contains over 5300 articles on almost every topic, camera, lens and printer you can imagine. Our membership model is simple, just $2 a month ($24.00 USD a year). This $24 gains you access to a wealth of information including all our past and future video tutorials on such topics as Lightroom, Capture One, Printing, file management and dozens of interviews and travel videos.
- New Articles every few days
- All original content found nowhere else on the web
- No Pop Up Google Sense ads – Our advertisers are photo related
- Download/stream video to any device
- NEW videos monthly
- Top well-known photographer contributors
- Posts from industry leaders
- Speciality Photography Workshops
- Mobile device scalable
- Exclusive video interviews
- Special vendor offers for members
- Hands On Product reviews
- FREE – User Forum. One of the most read user forums on the internet
- Access to our community Buy and Sell pages; for members only.
You may also like