


Do I Really Need to Know This Stuff?
Actually, yes, you do. Pay attention. It’s important 🙂
You especially do if you’re one of those photographers who enjoys thinking about, reading about and talking about lens sharpness. The reason is that the wordsharpnessis vague and can mean different things at different times to different people. MTF on the other hand is the terminology that lens designers use, and which you need to come to terms with if you really want to understand how to describe the complex interaction between resolution and contrast.
For the optical designer contrast and resolution are in conflict. Increase one and you reduce the other. Various lens makers have differing philosophies in the regard. Historically, for example, Zeiss was reputed to design their lenses for maximum resolution, while Leica apparently tended to favour maximum contrast. It is design decisions like these that account in part for the differing “looks” of different lens brands.
Resolution & Contrast

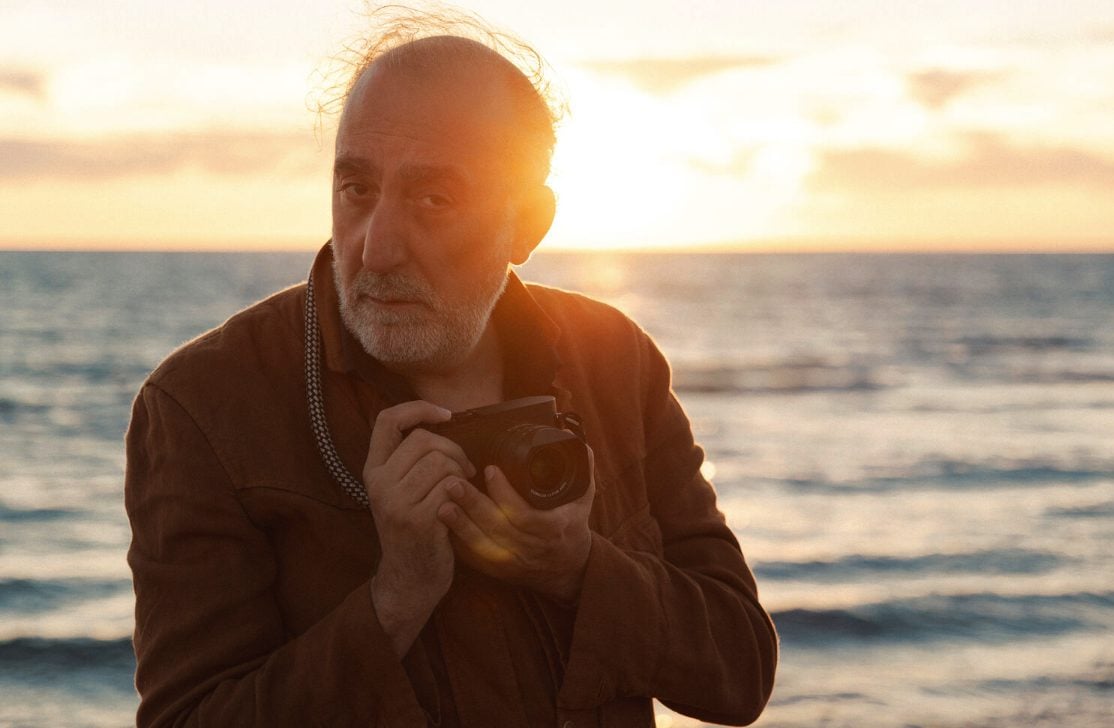
Heron Stalking — Algonquin Provincial Park. June, 2003
Canon 10D with Canon 500mm f/4L IS lens @ ISO 400
Resolution and contrast are inseperably bound. Think of a series of alternating lines; black, then white, then blank, then white again. What differentiates them is their contrast. Make the black lines lighter and the white ones darker and eventually you won’t be able to tell them apart. In other words, if you have a white line on white paper you have no contrast and therefore no resolution . The line will be invisible. Keep this in mind, because a discussion of resolution without taking contrast into account is meaningless.
Resolution is usually measured in lines per millimeter, or line pairs per millimeter. (L/mm and LP/mm). Be careful not to confuse the two. These are not the same. Typically engineering types refer to lines per millimeter, rightly assuming that to have a black line one must also have a white line. But, photographers tend to be less rigorous in their thinking and soline pairs per millimeteris commonly used. Just be aware of what is being discussed, but also be aware that numerically L/mm is double LP/mm. 50 L/mm to an engineer means 50 line pairs, because as discussed above every black line must have matching white line. This is similar to the confusion that exists between DPI (dots per inch) and PPI (pixels per inch). Different, to be sure, but similar enough in common usage so you need to know what each is actually referring to.
The next thing to realize is that resolution is not a quantifiable scientific absolute. It is totally subjective, and therefore is different between individuals as well as with the same individual at different times. While one observer may be able to see a resolution of 50 L/mm on a particular test, another may see 45 L/mm or 55/ L/mm. A 10% variance with the same observer at the same time is not at all unusual. Add to this the other variables, such as focusing errors, and I’ve been told by experts that a variance of as much as 30% in such tests is not uncommon.
And, to make things even more indeterminate, it can clearly be shown that the actual image quality produced by a lens does not correlate at all well with its measured resolving power. For this reason, resolution test results alone should not be considered a valid measure of a lens’ goodness. This is why the optical industry as well as those that really want to understand how a lens is performing rely instead on its MTF.
MTF — A Definition
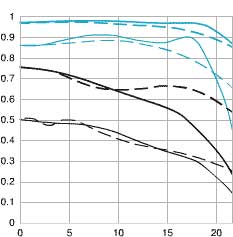
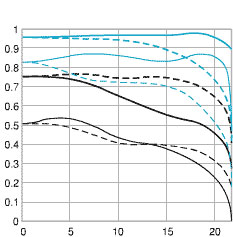
Fig. 1
MTF of Canon 50mm f/1.4 lens
Of course, you want to know how to interpret an MTF chart, and we’ll get to that most important aspect in a moment. But first take a moment to understand how MTF is defined.
An ideal lens would perfectly transmit 100% of the light that passes though it. But, no lens is perfect, and therefore there are losses. When these losses are measured in terms of contrast this is called the modulation of contrast. In other words, how much contrast is lost —modulationsimply being another word for variance.
This modulation of contrast is measured at different spatial frequencies. What does that mean? Simply, the number of contrasting bars on a test target, ranging from 0 to 100 line pairs per millimeter.
Look at Figure 1 above. It shows the MTF chart for a Canon 50mm f/1.4 lens. Ignore the squiggly lines for a moment and look at the vertical and horizontal axes. The vertical axis shows numbers from 0 to 1, which is really shorthand for 0 to 100%. Therefore .10 means 10% contrast, .5 is 50% contrast, and 1 is 100% contrast.
The horizontal axis is in millimeters and shows the distance from the center of the image toward the edges. In other words, 0 on the horizontal axis is the center of the lens and 20 is 20mm out from the center. Since a 35mm frame is nominally 36mm across this point is therefore at the edge of the frame.
Are you with me so far? To summarize — the higher a point is on the chart the higher the contrast transfer capability, and the further to the right one is the further from the center of the image.
Now let’s talk about the measurement lines. You’ll notice in Fig.1 above that there are blue as well as black lines, and thick as well as thin ones. Each of these line types is also shown as solid and dotted, for a total of 8 different line types. Here’s what each represents;
The thick lines are measurements taken at 10 LP/mm (low spatial frequency, or low resolution) and the thin lines are at 30 LP/mm, at higher frequency / higher resolution.
The black lines are measurements taken with the lens wide open, and the blue lines are with the lens at f/8.
The solid lines are meridonial while the dotted lines representsagittalmeasurements.
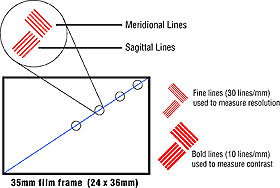
To quote from Canon’s explanation of what meridonial and sagital mean….
Fine repeating line sets are created parallel to a diagonal line running from corner to corner of the 35mm frame, directly through the exact center of the image area. These are called sagital lines, sometimes designated “S” on Canon’s MTF charts. At a 90° angle to these, additional sets of repeating lines are drawn, called Meridonial (or “M”) line sets.
Don’t sweat this for the moment. Why this is relevant though will become clearer when we look at how to interpret the charts, especially with regard to a lens’bokeh.
How to Read an MTF Chart
We’re now ready to learn how to read an MTF chart.
As we look at the chart keep in mind that the higher up the chart a line is, the higher the contrast, and that 0 to 20 across the bottom scale represents from the center of the lens to the edge. Ignore the dotted vs. dashed lines for the moment.
Here are some rules of thumb for reading a chart…
— the higher up the chart the 10 LP/mm line is (the thick lines), the higher the contrast reproduction capability of the lens will be.
— the higher up the chart the 30 LP/mm line is (the thin lines), the higher the resolving power and thus subjective sharpness of the lens will be.
— keep in mind that the black linesshow the lens wide open while the blue linesshow the lens stopped down to f/8, so the closer these sets of lines are to each other the better the performance of the lens when used wide open. The very best lenses will have the black and the blue lines close together.
— generally speaking a lens whose thick lines (10 LP/mm) are above .8 on the chart should be regarded as having excellent image quality. Above .6 is regarded as “satisfactory”. Below .6 is, well, below.
One of the areas of image quality that MTF can help determine is bokeh. This is a Japanese word used to describe the manner in which a lens reproduces the out of focus areas of an image. Some lenses are harsh in this regard, while others produce a much more pleasing out of focus image. This is where the meridonial and sagital lines come in, and as you’ll recall are represented by the dotted and dashed lines. The closer these lines are to each other the more pleasing the bokeho f the lens. Fascinating, huh?
Themeridonialandsagitallines are also used to evaluate astigmatism and field curvature — subjects which are beyond the scope of this brief essay.
Finally, be aware that an MTF chart doesn’t tell us everything that there is to know about a lens. Important variables such as vignetting, linear distortions of various sorts, and resistance to flare are among the things not measured. An MTF chart isn’t gospel, but it does help us to understand how a lens performs in terms of certain important characteristics.
Some Examples
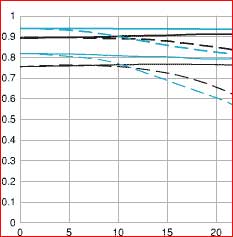
 Canon 135mm f/2LCanon 35mm f/1.4L
Above are the MTFs of two of Canon’s finest fast prime lenses, arguably among the finest lenses available of their respective focal lengths. They are shown here for no other reason than to allow you to practice what you’ve learned above. What do these charts tell you about the characteristics of these two lenses? Figure it out using the above explantions.
Note though that telephoto lenses are inherently superior to wide angle lenses, and that therefore you should never judge them against each other, only against other lenses of the same focal length.
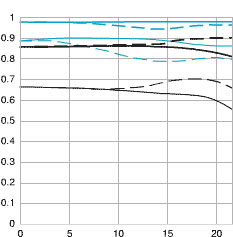
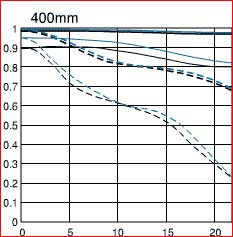 400mm f/5.6 lens100-400mm f/3.5-f/5.6 lens @ 400mm
If you are a regular reader of this site you may recall a bit of a furor that I caused when I claimed that in my initial experience with the Canon 400mm f/5.6L it was found to be superior to the Canon 100-400mm zoom. But, as you can see from the above MTF charts, now that you know how to read them, the difference that are seen can be easily be quantified.
Footnote
All MTF charts on this page are courtesy of Canon Inc. You can view complete lens specs and MTF charts of all Canon lenses on the Canon US web site.
Canon’s MTF charts are based on theoretical calculations used in the design of the lens, while some other manufacturers use actually measurements. There are valid arguments in favour of both methods. Be aware though that different manufacturers have different measurement procedures, and therefore while comparing MTF charts between lenses in the same line is possible, and is in fact very useful in making a purchasing decision, doing so between different manufacturer’s MTF charts isn’t.
Why have I used Canon’s charts? Simply because to my knowledge they are one of the few companies that regularly publishes such charts for all of their lenses. Leica also makes them available. The only other that I know of is Contax / Zeiss. Update: Apparently Nikon also publish MTF charts for some of their lenses, but only via their Japanese language web pages. These can be found here.
More
In Issue #8 of The Luminous Landscape Video Journal, published in August, 2003, I have an interview with scientist and photographer Norman Koren. In it we explore the topic of sharpness, aspects of resolution, contrast, MTF and noise — a fascinating conversation.


Elevate Your Vision


Read this story and all the best stories on The Luminous Landscape
The author has made this story available to Luminous Landscape members only. Upgrade to get instant access to this story and other benefits available only to members.
Why choose us?
Luminous-Landscape is a membership site. Our website contains over 5300 articles on almost every topic, camera, lens and printer you can imagine. Our membership model is simple, just $2 a month ($24.00 USD a year). This $24 gains you access to a wealth of information including all our past and future video tutorials on such topics as Lightroom, Capture One, Printing, file management and dozens of interviews and travel videos.
- New Articles every few days
- All original content found nowhere else on the web
- No Pop Up Google Sense ads – Our advertisers are photo related
- Download/stream video to any device
- NEW videos monthly
- Top well-known photographer contributors
- Posts from industry leaders
- Speciality Photography Workshops
- Mobile device scalable
- Exclusive video interviews
- Special vendor offers for members
- Hands On Product reviews
- FREE – User Forum. One of the most read user forums on the internet
- Access to our community Buy and Sell pages; for members only.
You may also like