


Readers of my printer and paper reviews know that I first present and discuss a data set that describes how accurately a printed sample of colors (including grays) reflects the numerical values of those colors in the image file. The reason for this concern is that after adjusting colors to our taste in a color-managed workflow, we want printed results to faithfully portray what we thought we sent to the printer. So, the extent to which the printer/profile/paper combination (PPP) is capable of achieving this should be important to know, and to a considerable extent, we can know, thanks to objective data-based analysis. Not to say that inaccuracy makes prints poor – it doesn’t necessarily; it all depends on the extent and characteristics of inaccuracy and the nature of the photograph. Regardless, more accuracy is generally a safer proposition for success than less accuracy.
But using data to provide a visually consistent impression of what we perceive when looking at the colors is a difficult mental transition; so, in the context of measuring the extent of inaccuracy between image file numbers and the numbers read from the print, what if there were disconnects between what data may lead us to believe versus what we see on paper?
In fact, there often are such disconnects, notwithstanding that “dE” calculations attempt to bridge them.
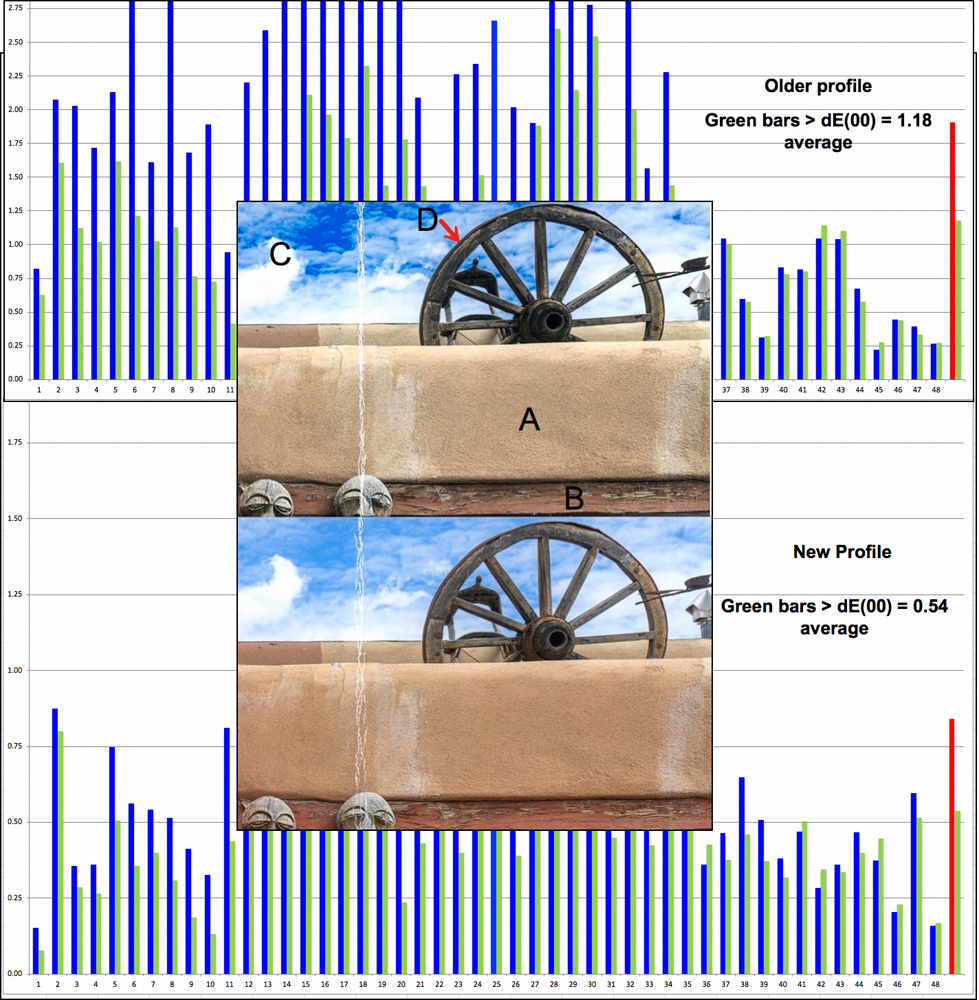
A frequent question arises about how large the dE values need to be before the indicated color inaccuracy could begin to affect one’s enjoyment of the print. This is a very deep subject that color scientists have been working on for many decades, and I am not a color scientist; nonetheless, I have undertaken, and am reporting here, some exploration that provides tangible insights on the relationship between data and observation that may be useful to those interested in the question of the extent to which data-driven performance evaluations provide useful insight about the extent and visual importance of perceived color differences.
Because this analysis is very long and requires some concentration, we are providing it as a PDF download which you may access here. If you are in a rush, you’ll find the conclusions at the end. Enjoy!
Download PDF – [wpdm_package id=’18418′]
Mark D Segal
Locked-down in Toronto., April 2020.


Elevate Your Vision


Read this story and all the best stories on The Luminous Landscape
The author has made this story available to Luminous Landscape members only. Upgrade to get instant access to this story and other benefits available only to members.
Why choose us?
Luminous-Landscape is a membership site. Our website contains over 5300 articles on almost every topic, camera, lens and printer you can imagine. Our membership model is simple, just $2 a month ($24.00 USD a year). This $24 gains you access to a wealth of information including all our past and future video tutorials on such topics as Lightroom, Capture One, Printing, file management and dozens of interviews and travel videos.
- New Articles every few days
- All original content found nowhere else on the web
- No Pop Up Google Sense ads – Our advertisers are photo related
- Download/stream video to any device
- NEW videos monthly
- Top well-known photographer contributors
- Posts from industry leaders
- Speciality Photography Workshops
- Mobile device scalable
- Exclusive video interviews
- Special vendor offers for members
- Hands On Product reviews
- FREE – User Forum. One of the most read user forums on the internet
- Access to our community Buy and Sell pages; for members only.
You may also like