


The three main cost categories are: (1) the machine, (2) ink and (3) paper. This data is in Canadian dollars (CAD). Multiply by about 0.8 for US dollar equivalent.
(1) The machine
Five factors determine the cost per print of the printer: (i) purchase price including taxes, (ii) retention period, (iii) rate of return, (iv) throughput and (v) estimated disposal value.
My 4000 all-in cost including the CAD 200 of ink consumed in the initial charge-up was CAD 2903. I am assuming a 24 month retention period, 6% annual rate of return (a conservative return on alternative “safe” investments) or 0.5% per month and a disposal value of CAD 700 at the end of 24 months. Using an Excel function for calculating monthly capital consumption value based on these assumptions, the monthly amortization of the machine is CAD 97.64 (cell K6 in the table below). This is a fixed cost regardless of how many prints are made. The layout of this calculation in my Excel-based costing model looks like Table 1. (Ignore row 5 for now – it is explained later.)
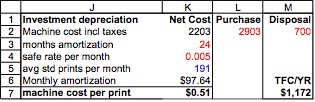
Cell M7 shows the annual machinery overhead cost being CAD 1172 (monthly cost times 12). The recent ruckus on Luminous-Landscape about accelerated “obsolescence” of the Epson 4000 (because the 4800 appeared within a year of the 4000’s debut) is really all about the impact of retention period on capital cost. Using this model to make alternative assumptions about holding periods and forecast (therefore uncertain) end-of-period resale values, one can simulate comparators to the CAD 1172 Total Fixed Cost (TFC). A set of estimates is shown in Table 2:
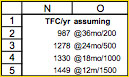
This table simply shows that if I were to keep my printer for three years and expect to sell it for CAD 200 then, or if I sold it at the end of one year for CAD 1500, there is a gross difference in TFC/year of only CAD 462. That is why I argued in the Forum that technical progress is more important than accelerated obsolescence.
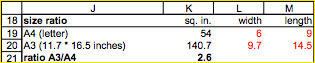
The next step is to track throughput in order to know, inter alia, how much capital cost to attribute to a print. In a separate but related sheet within the same Excel workbook there is a “photo log” that tracks the date, the job, the number of “standardized prints” (SP) per date per job and in cumulating total over time, as well as ink usage, wastage, and print-head cleanings (all discussed further below). The concept of an SP would vary from person to person. My typical usage consists of two print sizes: Letter (or A4) and A3. On a Letter-sized piece of Enhanced Matte I would typically place a 6*9 inch print, creating 54 square inches of ink coverage. A Letter Size print is my accounting unit, or “standardized print” (SP) when I talk of cost per print. On an A3 sheet I would typically place a 9.7 by 14.5 inch print, creating 140.7 sq. in. of ink coverage, or 2.6 times that of an SP, as shown in Table 3. When I track the number of prints I make, each A3 is entered as 2.6 SPs.
(One could just as easily do all this by the sq. ft., which would better suit some professional studios that charge for printing by the sq. ft., but I’m not a commercial service and I like to think in terms of prints. I do, however, provide costs per sq. ft. near the end of this note.)
Cell K5 in Table 1 shows that so far I have made an average 191 SPs per month. This is a modeled result using (i) the dates from the photo log in a date formula automatically tracking cumulating printer retention period (“elapsed days” and equivalent months in Table 4) and (ii) the total number of SPs cumulated to date – now 1710.8 SPs.
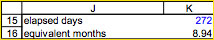
1710.8 SPs divided by 8.94 months yields about 191 SPs per month. Dividing this number of SPs into the monthly machine value of CAD 97.64 results in a machine cost of CAD 0.51 per SP (Table 1 cell K7) – not insignificant. Higher or lower throughput per month will yield inversely proportionate machine cost per print.
(2) Ink
Two activities consume ink: (i) making prints and (ii) print-head cleanings. Print head cleanings fall into three categories: (i)auto-cleans that happen when the printer is turned on, (ii) auto-cleans that happen part-way through print sessions, and (iii) user-triggered auto cleans needed to clear clogs that occur beyond the scope of the machine’s auto-cleans. In the Epson 4000, ink consumption data is very easily obtained by running a nozzle check before and after each printing session. The nozzle check print-out (Figure 1 below) shows both the total cumulative amount of ink the machine has used up to the completion of the present check and that up to the most recent previous machine usage. By subtracting the previous from the current statistic, the result is ink consumption for the current usage. (Running the nozzle check consumes only 0.3 ml of ink.)
Type (i) auto-cleans use 4.1 ml of ink each time, as shown in Figure 1, which is an example of a nozzle check run immediately after a type (i) auto-clean and before printing photos. The photo log in the costing model is configured to track type (i) and type (iii) cleanings as a separately identifiable “cleaning” sub-set within total ink usage. It is not possible to separately track type (ii) cleanings because they occur during a printing session with no advance warning. Therefore some of the per session ml/SP calculated in column S of Table 5 below are outliers – they probably embed type (ii) auto-cleanings having variable effect on ml/SP depending on the number of prints made in the session, or they include several type (i) cleanings that I forgot to earmark as required in the model, hence got included within the session total ink usage for prints.
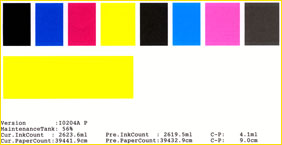
Table 5 shows how aggregate, per session, per job and per SP ink usage are tabulated in the photo log. Rows 1, 2 and 3 show the totals for all 110 sessions and all jobs to date (discussed later), while each row underneath (small extract shown) is one per session/date. The Grand Total data of column P is the sum for all the jobs done in each session and in total for all sessions. There is one column per job category preceding column P (including one called “Waste”, shown here in Column O. “Waste” is simply one job category accounted like all others. I discuss the use of Waste data below).
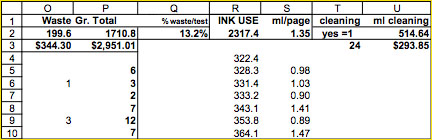
An example illustrates how this section of the model works. Cell R4 shows that I started tracking ink usage from just after the amount used to charge-up the machine (322.4 ml) onward. My first printing session back in October 2004 is summarized in cell P5, being 6 SPs – after which total cumulative ink usage read from the closing nozzle check print-out was 328.3 ml (cell R5). Cell S5 shows in that session the printer used 0.98 ml/SP, derived from a formula in that cell calculating current minus previous cumulative ink use divided by current SPs, or (328.3 ml. – 322.4 ml.)/6 SP = 0.98 ml/SP.
As evident even from the small extract of sessions in Table 5 (rows 5 to 10), ink usage per SP varies from session to session depending on the kind of prints being made and whether the machine experienced a type (ii) cleaning, which does not get separately tracked, and therefore is included in ink consumption for the session in which it occurred. Figure 2 is a histogram showing the range of ml/SP consumed over the 110 sessions accounted from October 6 2004 to July 5, 2005.
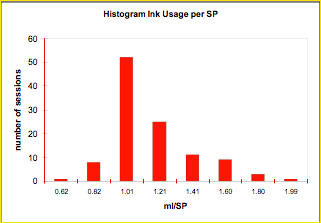
For 77 of the 110 sessions, Figure 2 shows that ml/SP of ink ranged between 1.0 and 1.2. The data above this range probably reflects the inclusion of type (ii) cleanings and some non-separated type (i) cleanings. This data excludes separately tracked type (i) and all type (iii) cleanings.
The variability of ink usage per session (due to kind of prints and type (ii) cleanings) and the erratic nature of type (iii) cleanings are the reasons why it is necessary to accumulate a long enough time period of operational experience to obtain a representative sample of the machine’s typical ink usage. After tracking 110 sessions, the overall average ml/SP including all three types of cleanings has stabilized to the point where I believe the sample I have accumulated reflects representative performance of an Epson 4000 in my operating conditions. Other people’s experience will vary, because ml/SP depends on kinds of prints made and cleanings, which latter depend on printing intervals, amounts printed, and the humidity in the room where the printer is housed. One can begin to understand why printer manufacturers are reluctant to publish ink consumption data.
Now, turning to the Grand Totals (rows 1 to 3) of Table 5, cell P2 shows I have made a total of 1710.8 SPs. Of this total, cell O2 shows 199.6 were waste, leading to a “waste ratio” of 13.2% calculated in cell Q2. (Yes, waste happens for variousreasons!) Cell R2 shows total ink consumption from immediately after the initial charge-up as being 2317.4 ml. Cell S2 is total ink used for prints and all cleanings (2317.4) divided by total SPs (1710.8), resulting in grand average ml/SP of ink equal to 1.35. This of course is much higher than indicated by the center-weight of the histogram in Figure 2; the difference is fully explained by the inclusion of type (i) and type (iii) cleanings in the grand average of cell S2 and their exclusion in the histogram, which only includes type (ii) cleanings. Cell U2 shows that 514.6 ml of ink were consumed for the sum of all type (i) and type (iii) cleanings that were separately tracked (24 episodes as shown in cell T3. The real treacherous culprits are the type (iii) cleanings which in my case have consumed from 13 ml to 84 ml each. Table 6, another section of model output, more clearly shows the distinction between ink for prints and ink for type (i) and type (iii) cleanings.
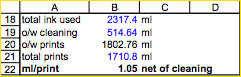
Each SP requires 1.05 ml on average excluding type (i) and type (iii) cleanings, but 1.35 ml including these cleanings. This is a substantial difference and demonstrates the importance of doing everything feasible to reduce type (iii) cleanings. Column U of Table 5 shows that so far the printer has consumed about 515 ml of ink for type (i) and type (iii) cleanings at a cost of about CAD 294. I have had extensive discussions with Epson about this, and Epson recommended that I try to maintain the room within a 25% to 45% humidity range. One easily incurs excessive dryness in a Canadian climate with central heating during the winter and air-conditioning during the summer. (It’s not entirely our fault that we are gluttons for energy here!) I discuss ink costs resulting from the above ink usage data below.
3) Paper
This is straightforward: here in Toronto I pay CAD 22.06 and CAD 58.00 including taxes for 50 sheets of Letter and A3 size Epson Enhanced Matte respectively.
Costing the Output:
Table 7 shows the costing module for consumables (ink and paper, with a section for print-heads in case the model were used for a non-Epson printer).
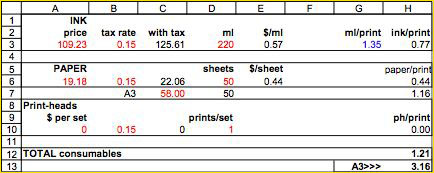
I pay CAD 125.61 including taxes for 220 ml of Ultrachrome ink, resulting in a cost of CAD 0.57/ml. At 1.35 ml per SP including cleanings, ink/SP works out to CAD 0.77. Letter-size paper is CAD 0.44 per sheet. Adding the two the cost of consumables is CAD 1.21 per SP, or CAD 3.16 per A3.
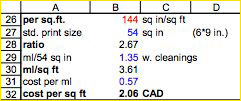
Luminous Landscape has received requests from commercial users for advice about the cost of ink per square foot of coverage. Table 8 shows the module for this calculation.
Adding the machine cost (Table 1, CAD 0.51) to the consumable cost (Table 7 CAD 1.21) results in a total fixed and consumable cost of CAD 1.72 per SP, or CAD 4.50 for an A3. This number multiplied by the number of SPs made in each job category is the total cost of printing that job. Taking, for example, “Waste” as a job category – cell O2 of Table 5, it has so far costed CAD 344.30 (199.6 SPs * CAD 1.72 each). Waste reduction is worthwhile!
Speaking of Waste, the model includes a module that calculates cost per USABLE print. The principle here is very simply that the “keepers” need to pay the freight for the “losers”. Hence the question is “by how much must I increase the cost of the keepers to cover the cost of the losers?” This is important information for printing labs and other professionals who must recover the costs of this “overhead” within the prices they charge for the goods that actually sell. The answer is found dividing the price per SP including waste (e.g. CAD 1.72 as reported above) by (1 minus the waste ratio) or in my case (1.0 – 0.132 = 0.868), resulting in a USABLE SP cost of CAD 1.99 (Table 9 cell K35). This is an automated real-time calculation, because the aggregate waste ratio changes with each session. (e.g., I had gotten mine down to near 11% before I decided to re-scan and reprint a bunch of images I was unhappy with, bringing my waste ratio up to 13.2%.)
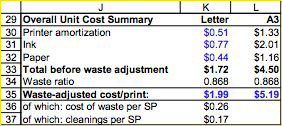
The waste-adjusted cost of an SP is CAD 1.99 (cell K35), of which waste is CAD 0.26 and print-head cleaning CAD 0.17. The cost of waste in cell K36 is simply K35 minus K33. Print-head cleaning cost per SP in cell K37 is from Table 5: cost of ink used for cleaning (cell U3) divided by total SPs (cell P2).
I conclude this discussion by reminding readers that this experience covers only the Epson 4000 printer sitting in my house. This costing model can be deployed for many other printers used under differing conditions, as long as detailed ink usage data can be extracted from those printers as it can from an Epson 4000. It would be interesting to see results reflecting a range of different printers and operating conditions. (The model is available to readers, but without “tech support”!)
Mark D. Segal
Consultant, Energy Economics, Toronto


Elevate Your Vision


Read this story and all the best stories on The Luminous Landscape
The author has made this story available to Luminous Landscape members only. Upgrade to get instant access to this story and other benefits available only to members.
Why choose us?
Luminous-Landscape is a membership site. Our website contains over 5300 articles on almost every topic, camera, lens and printer you can imagine. Our membership model is simple, just $2 a month ($24.00 USD a year). This $24 gains you access to a wealth of information including all our past and future video tutorials on such topics as Lightroom, Capture One, Printing, file management and dozens of interviews and travel videos.
- New Articles every few days
- All original content found nowhere else on the web
- No Pop Up Google Sense ads – Our advertisers are photo related
- Download/stream video to any device
- NEW videos monthly
- Top well-known photographer contributors
- Posts from industry leaders
- Speciality Photography Workshops
- Mobile device scalable
- Exclusive video interviews
- Special vendor offers for members
- Hands On Product reviews
- FREE – User Forum. One of the most read user forums on the internet
- Access to our community Buy and Sell pages; for members only.
You may also like